L-RROI
Visualize the impact of atmospheric opacity on rover instruments to help scientists reduce mission planning time.
Background
To enhance mission efficiency, the Mars 2020 team at NASA Jet Propulsion Laboratory (NASA JPL) is working to reduce rover daily planning time from 12 to 5 hours. Rover planning at JPL is a complex decision-making process, requiring consensus among various scientific and engineering teams to maximize discovery while maintaining the safety of the rover.
In 6 months, our team worked with NASA JPL to research and design L-RROI, a web-based platform that visualizes atmospheric opacity (tau) to help scientists quickly understand its impact on instruments and improve the decision-making process.
ROLE
- Collaborators: Yomna Hawas, John Sykes, Angela Yung
- Research synthesis, storyboard, interaction design, competitive assessment, wireframing, visual design, component library, UI specs, motion graphics.
Duration
- Mar - Aug, '19
- 6 months

Final Concept
Long-term Routing and Rover Instrumentation (L-RROI) is a web-based platform that uses the predictability of tau to help the mission teams shift from short-term to long-term planning, increasing efficiency for the Mars 2020 mission.
Anticipate and Validate
The current process of obtaining and analyzing tau data is lengthy and inefficient. L-RROI processes daily tau data from orbiters and landers and reconstructs it on top of the Martian terrain. At a glance, scientists can gain situational awareness of dust behavior and plan ahead for a global dust storm. They can also switch among Mars missions: Mars 2020, Curiosity, and InSight.
Make Informed Decision
During the planning process, scientists can select the instruments they are interested in using. L-RROI takes the input, integrates tau data, visualizes instrument conditions, and helps scientists identify the best time to conduct an activity. This helps scientists quickly eliminate time frames that could potentially affect rover's safety, reducing the back and forth between the science and engineering teams.
Detect trends
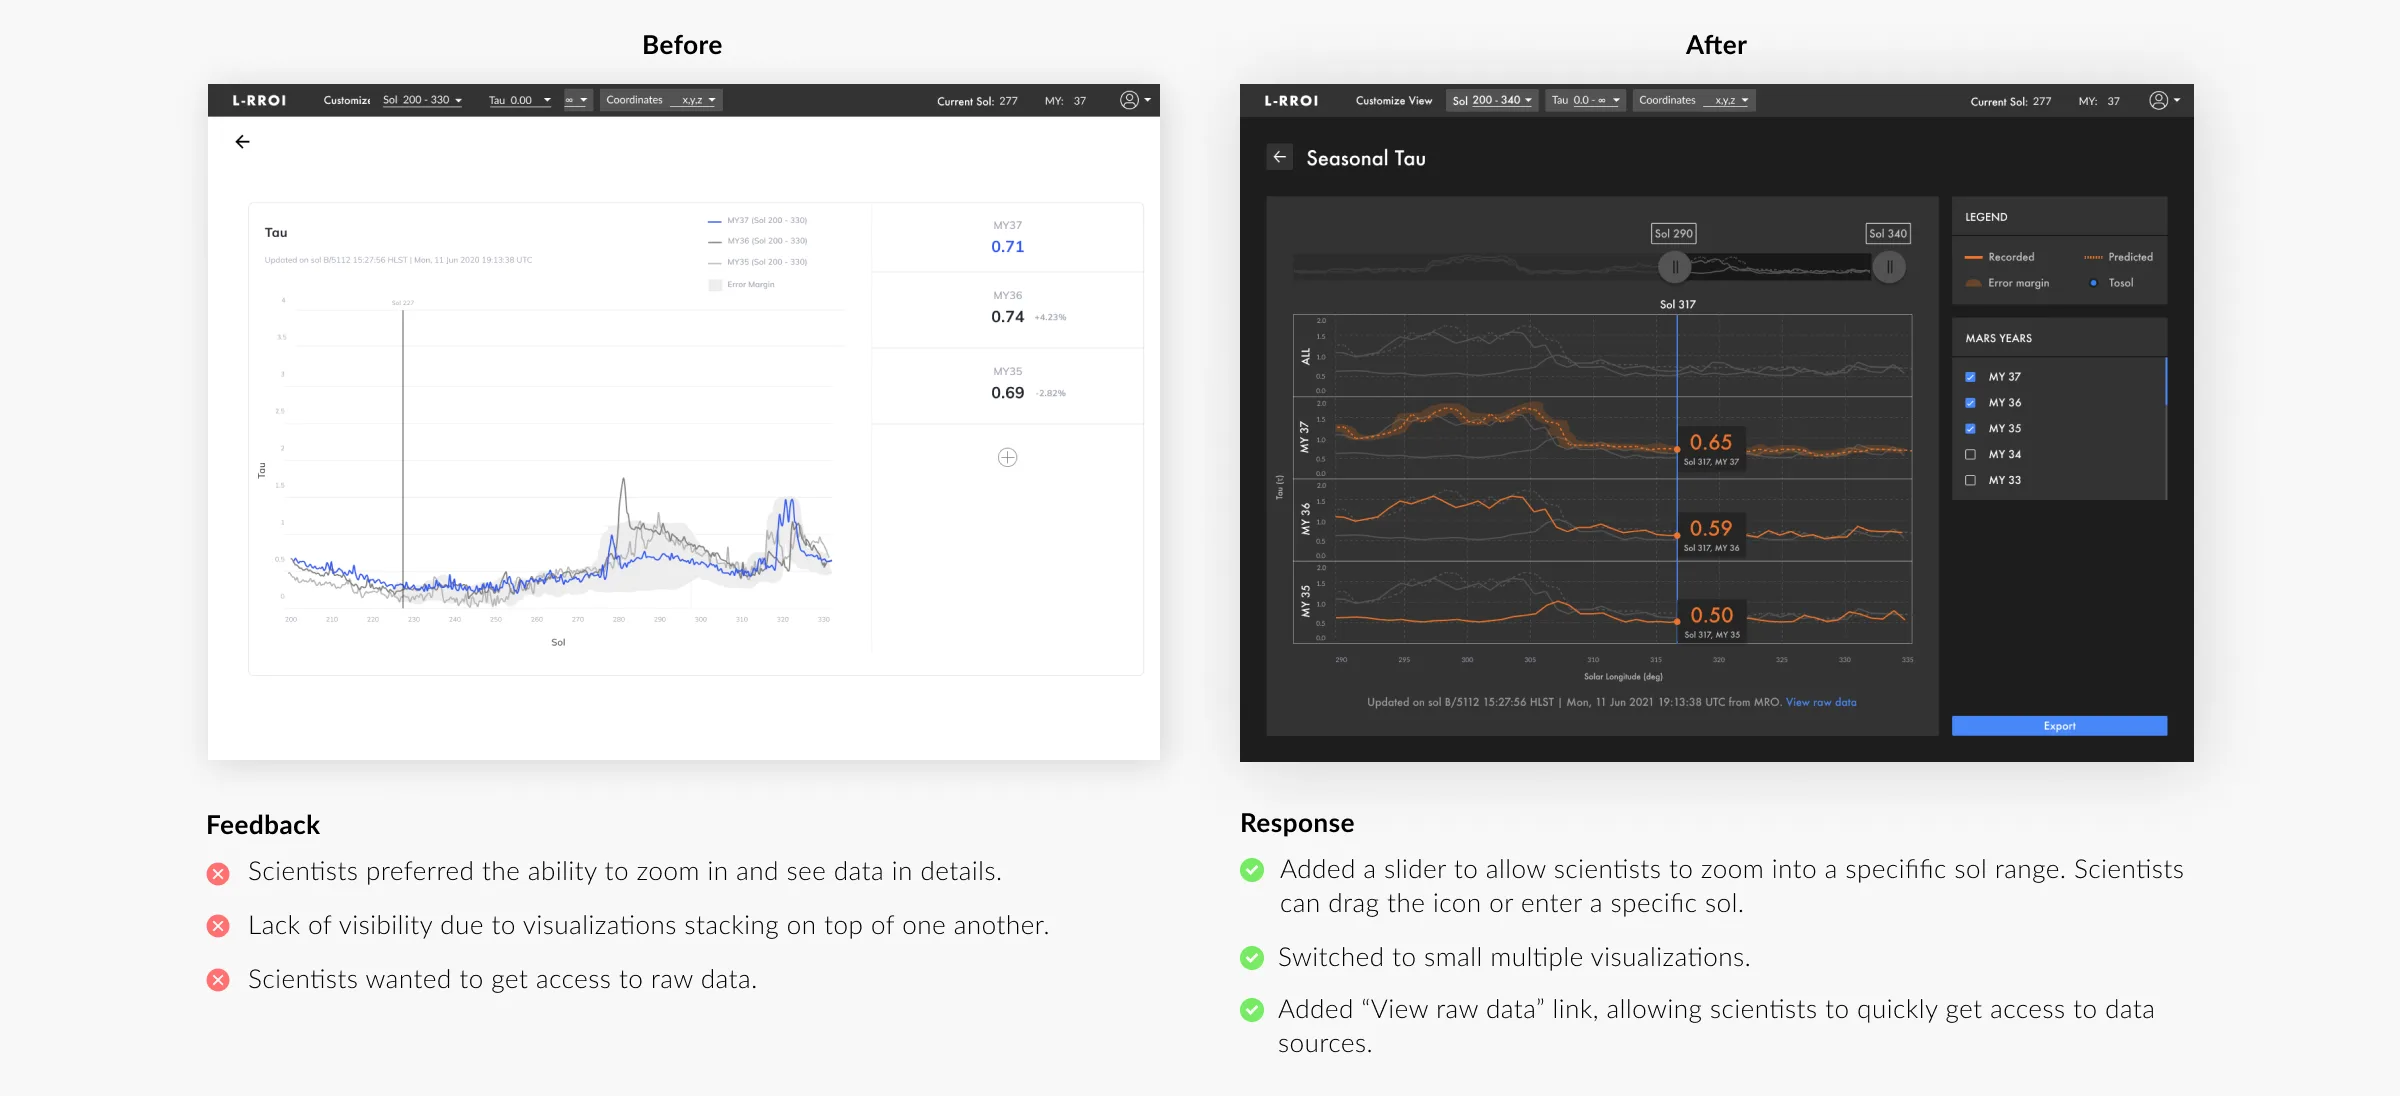
Understanding the history data is critical for the mission teams to evaluate and assess current rover plans. Scientists can use L-RROI to compare and contrast data, identify anomalies, and review data pattern overtime to plan, study, and predict future dust behaviors.
Simulate conditions
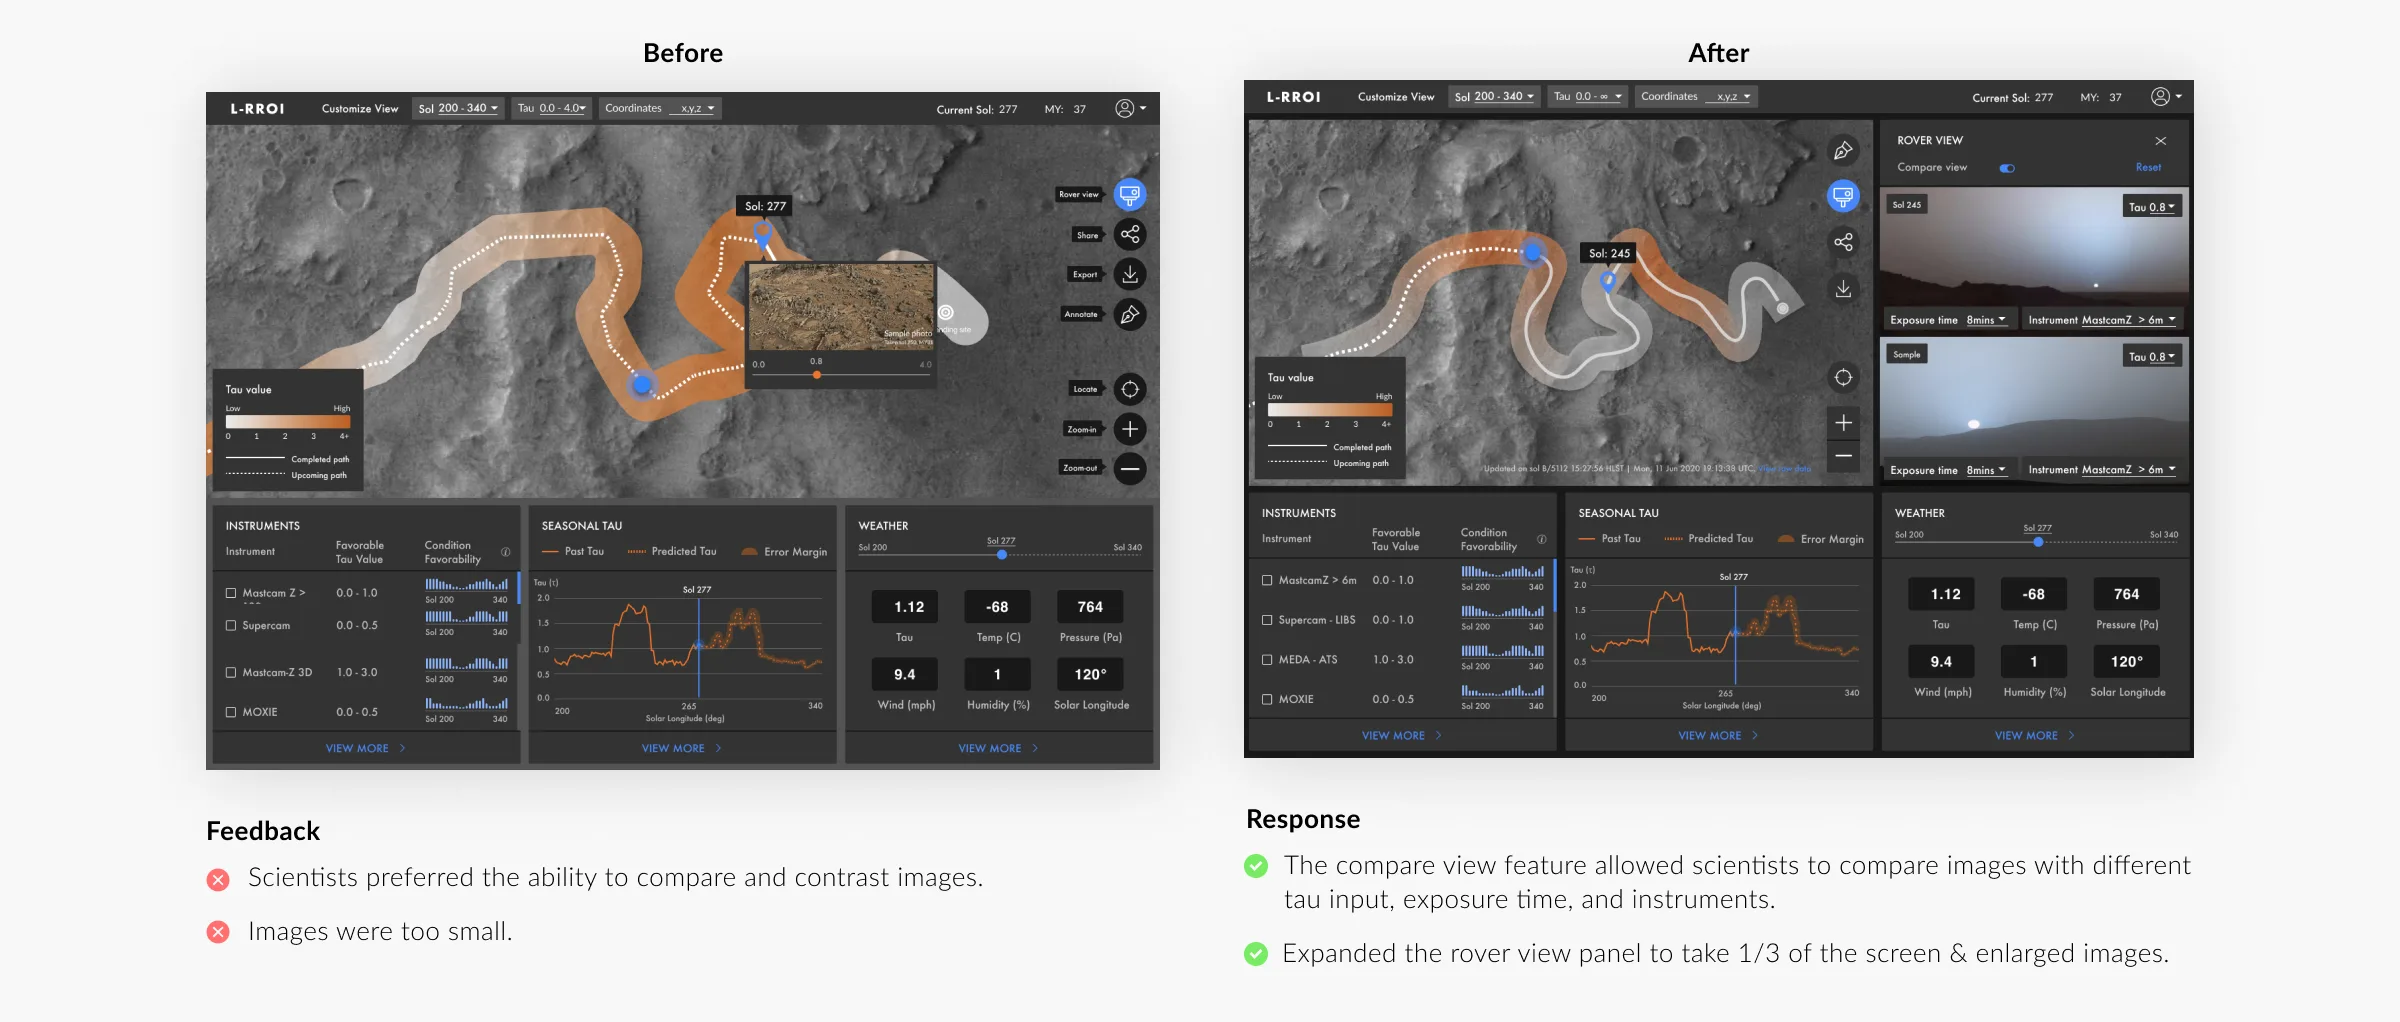
Dust increases camera exposure time and returns unclear photos. Knowing what the photos would look like at a certain time in the mission can help scientists anticipate and avoid wasting rover power on taking images that wouldn't be usable. L-RROI helps scientists simulate and compare various opacity conditions from the point of view of the rover. Scientists can drop a pin on the map to view past or predicted images. They can further compare and contrast images with different tau values to get a holistic view of tau effects.
Design Process
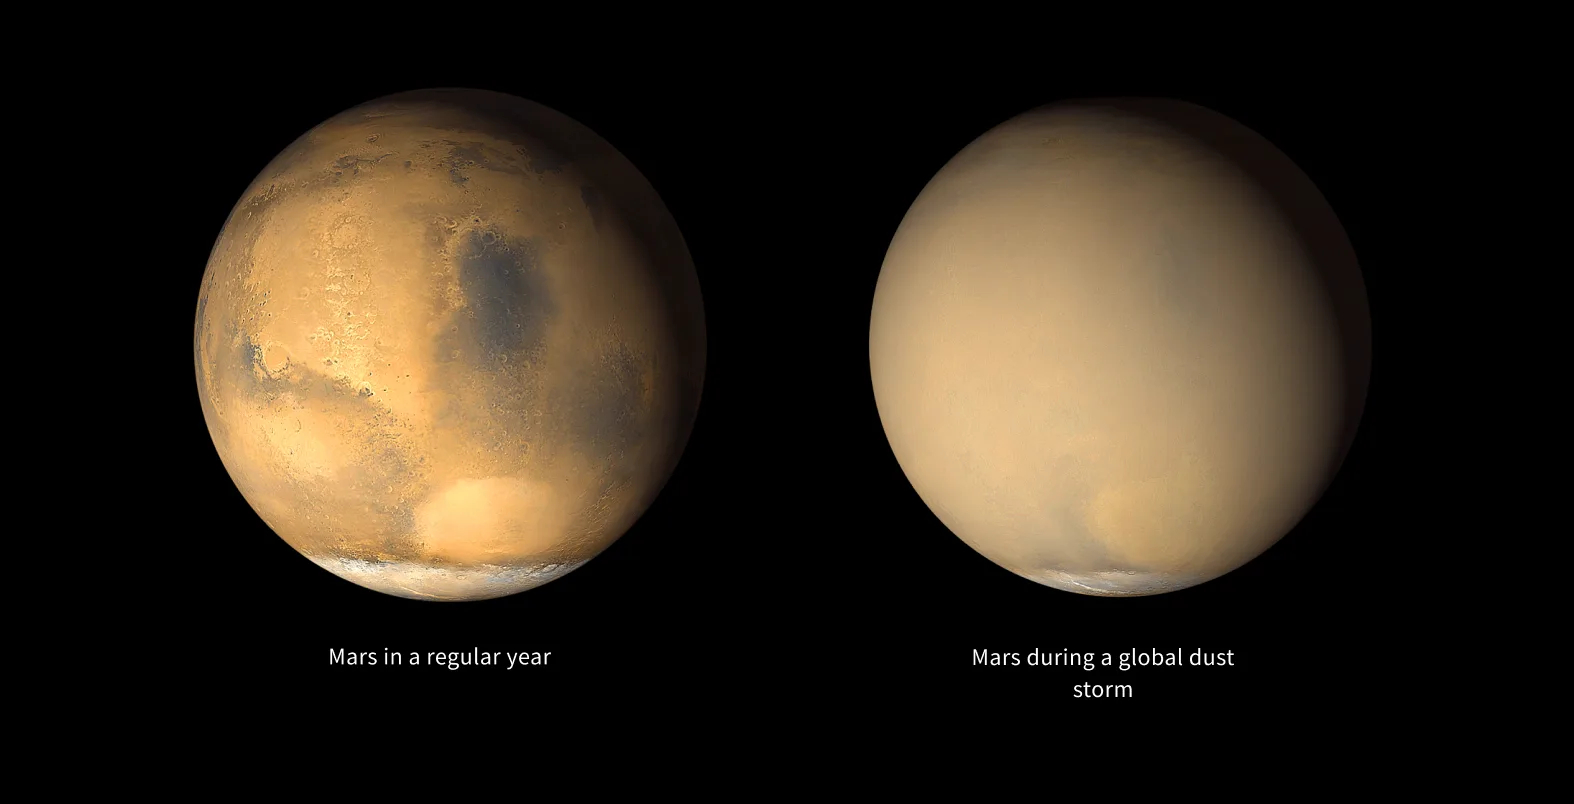
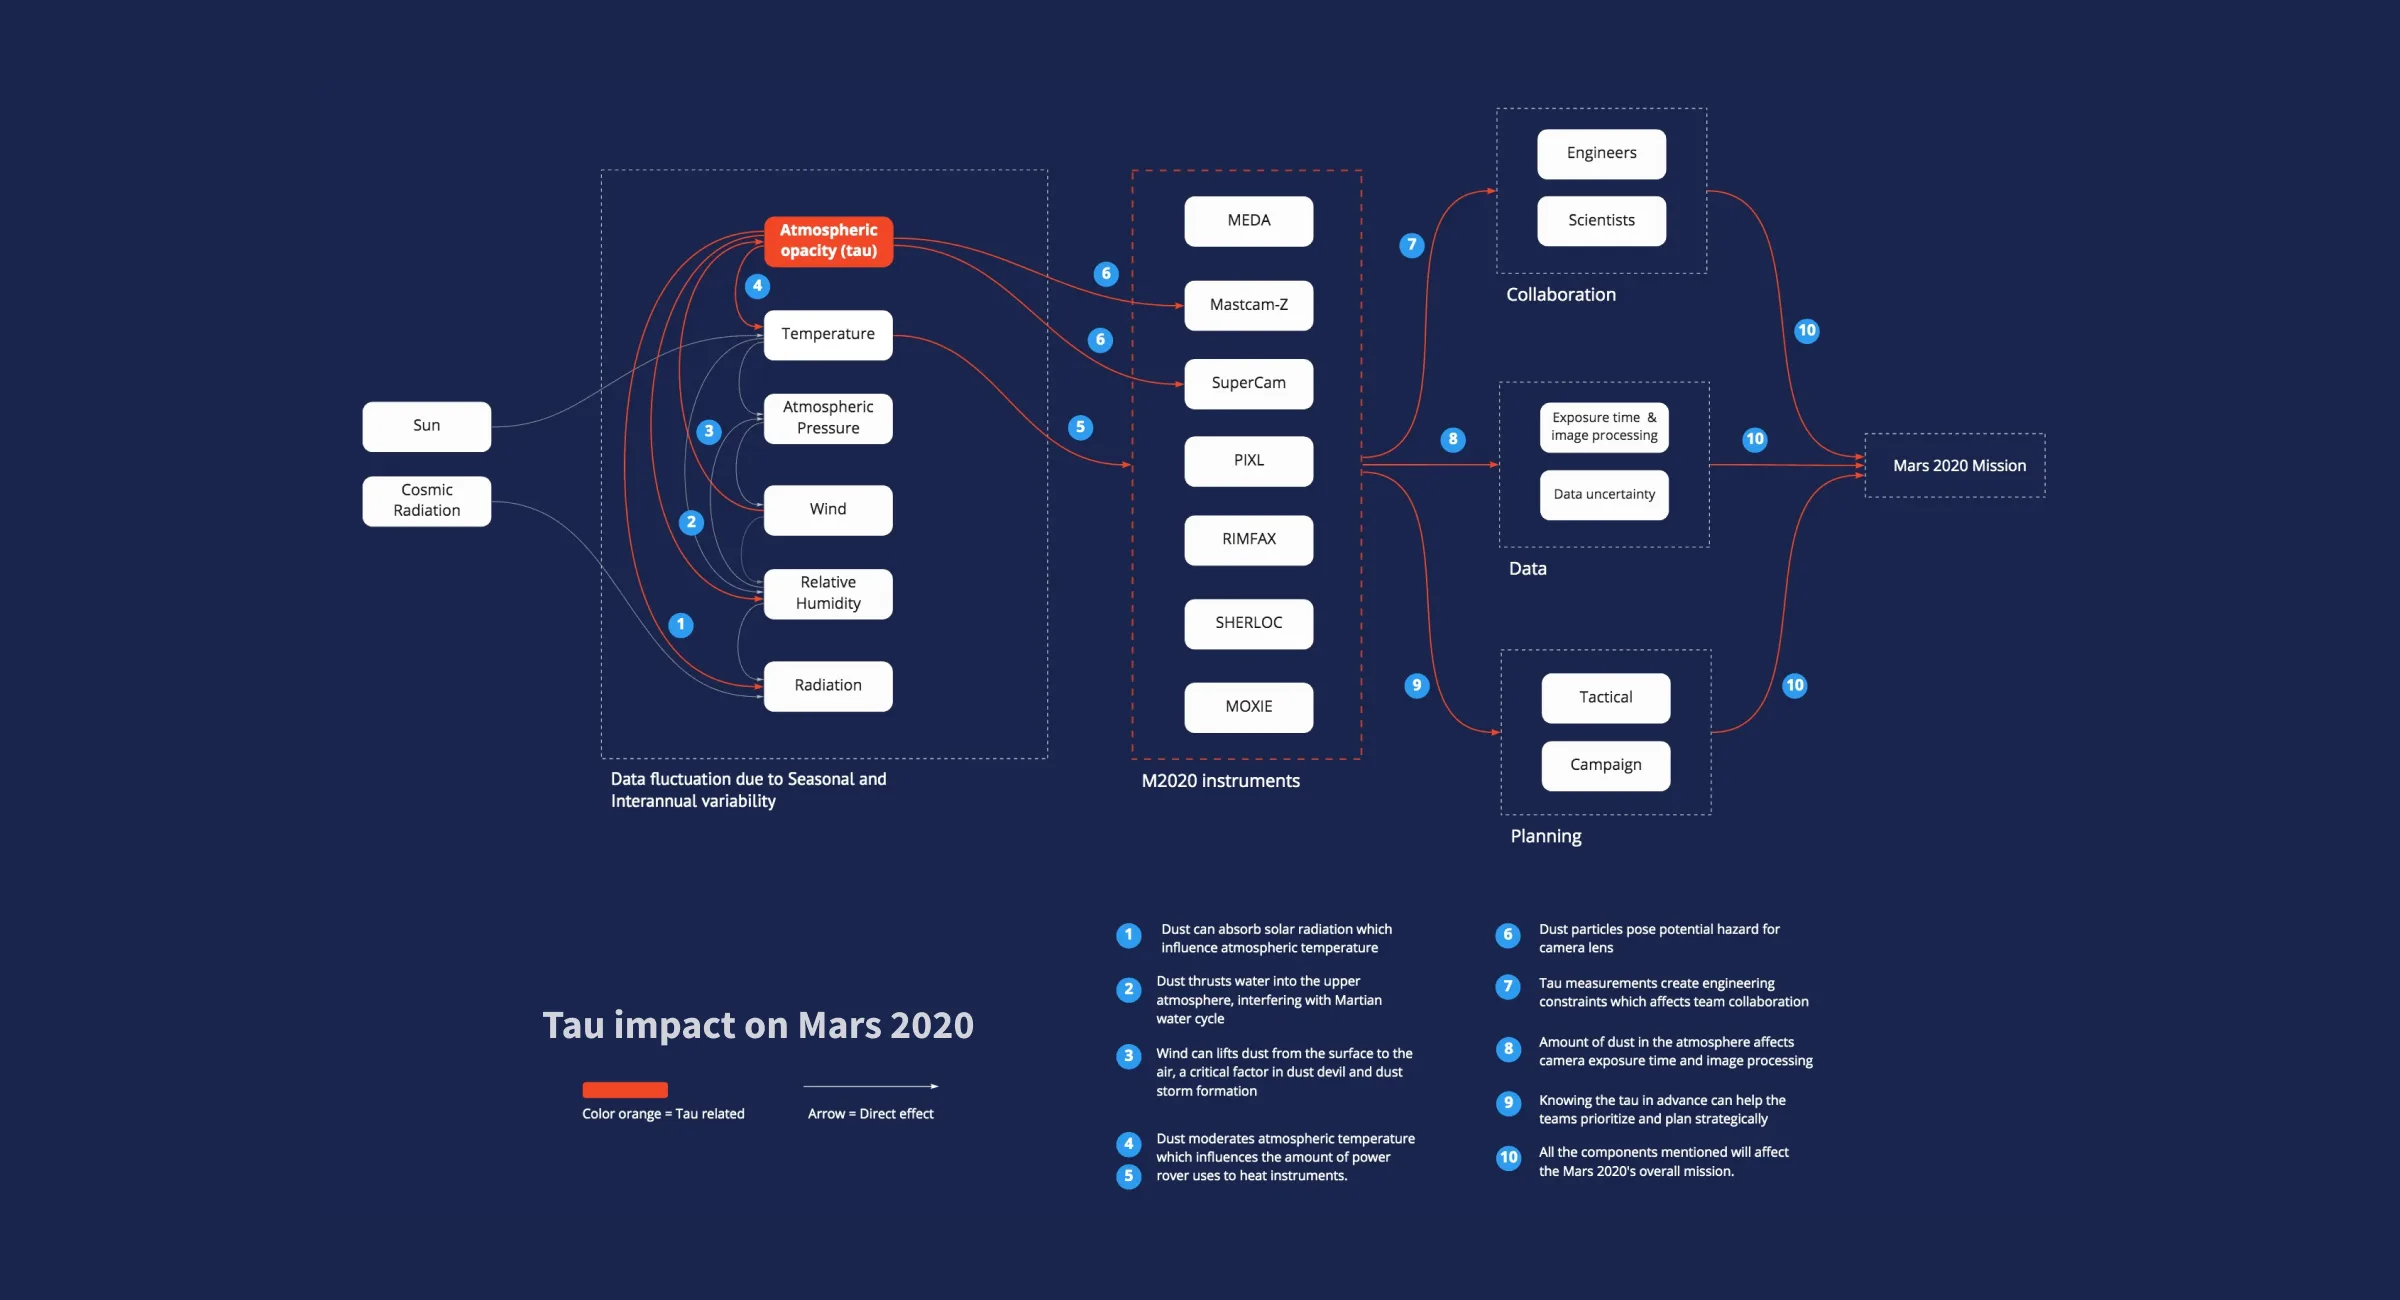
Tau plays an important role on Mars
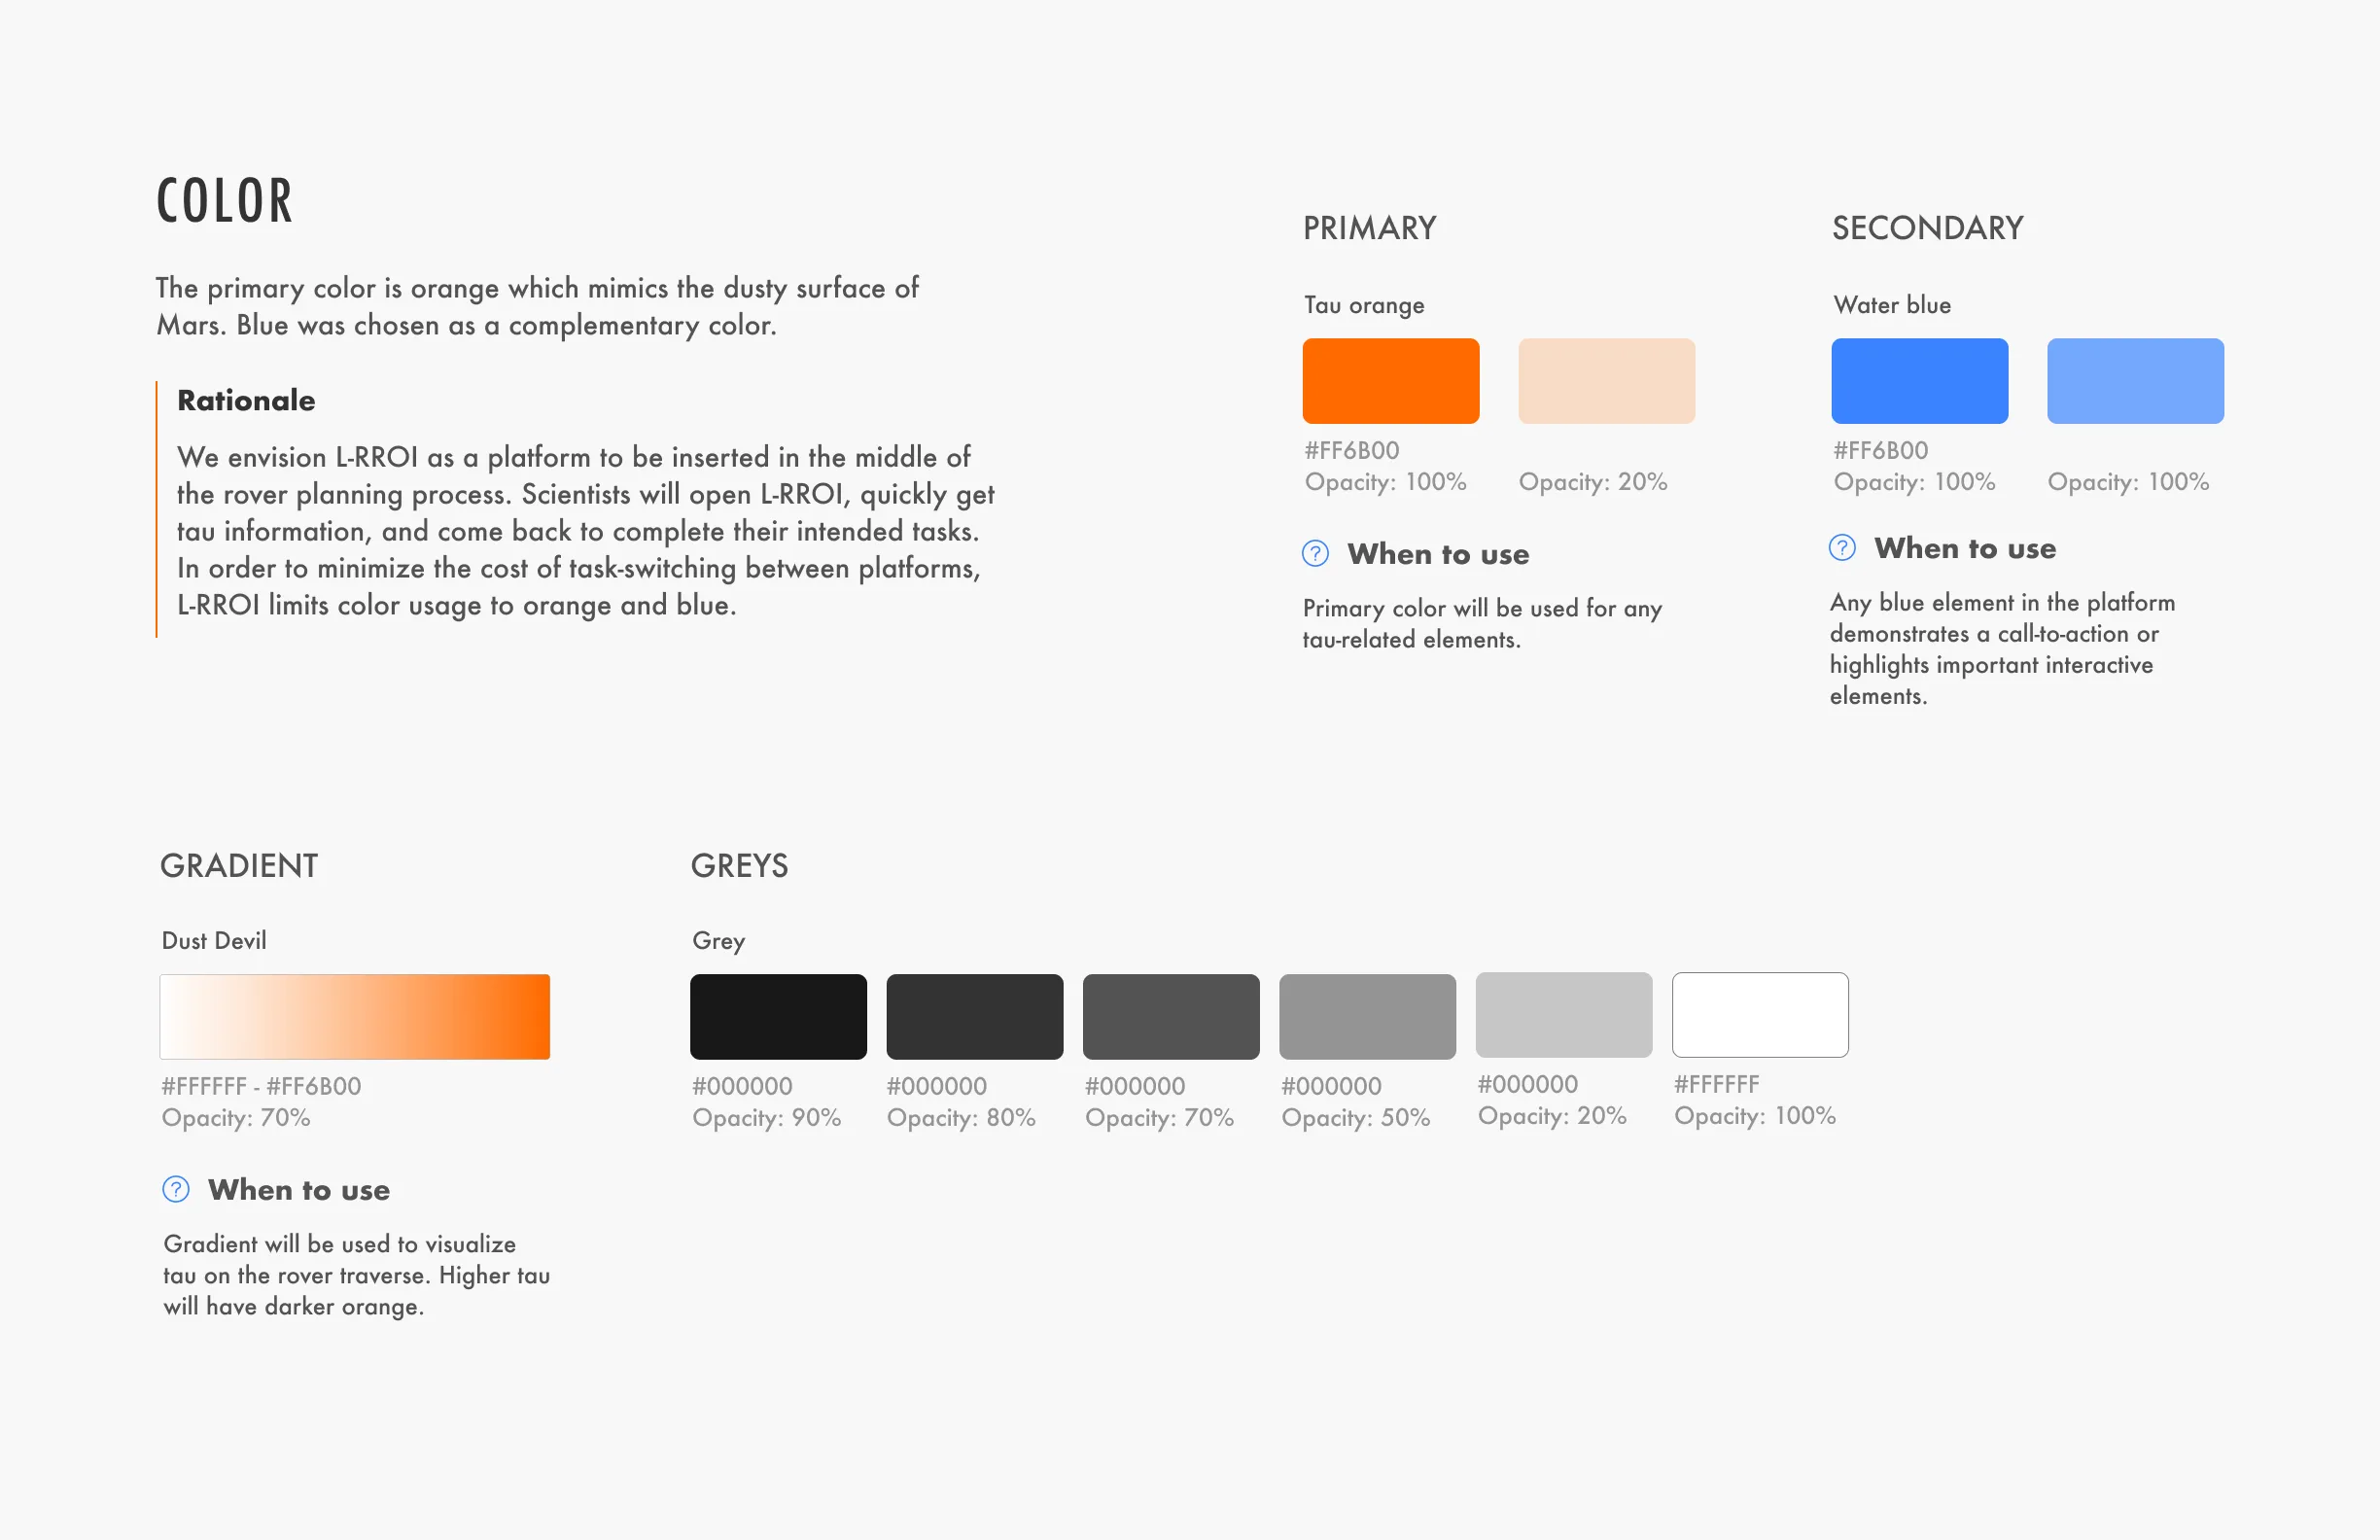
Atmospheric opacity (tau) is a measure of optical depth or how much sunlight can penetrate the atmosphere. Since Mars is covered with dust, the higher the tau value means there’s more dust in the air, and less sunlight can reach the surface.
Literature Reviews
We started by conducting literature reviews to understand the impact of atmospheric opacity (tau) on past missions and Mars 2020. We further looked into other topics such as NASA JPL structure, weather variables, collaboration, and data visualization to develop a holistic understanding of the problem space.
TAKEAWAYS
- Similar to the effect of water on Earth, dust dominates the surface of Mars and dictates most of its weather conditions.
- Each instrument aboard the rover has a preferred tau range to operate effectively.
- Dust deposition can harm camera lens, affecting rover’s ability to take clear photos.
- Dust particles can contaminate instruments and increase data uncertainty.
Scientists don’t get access to tau information with NASA’s existing planning tools
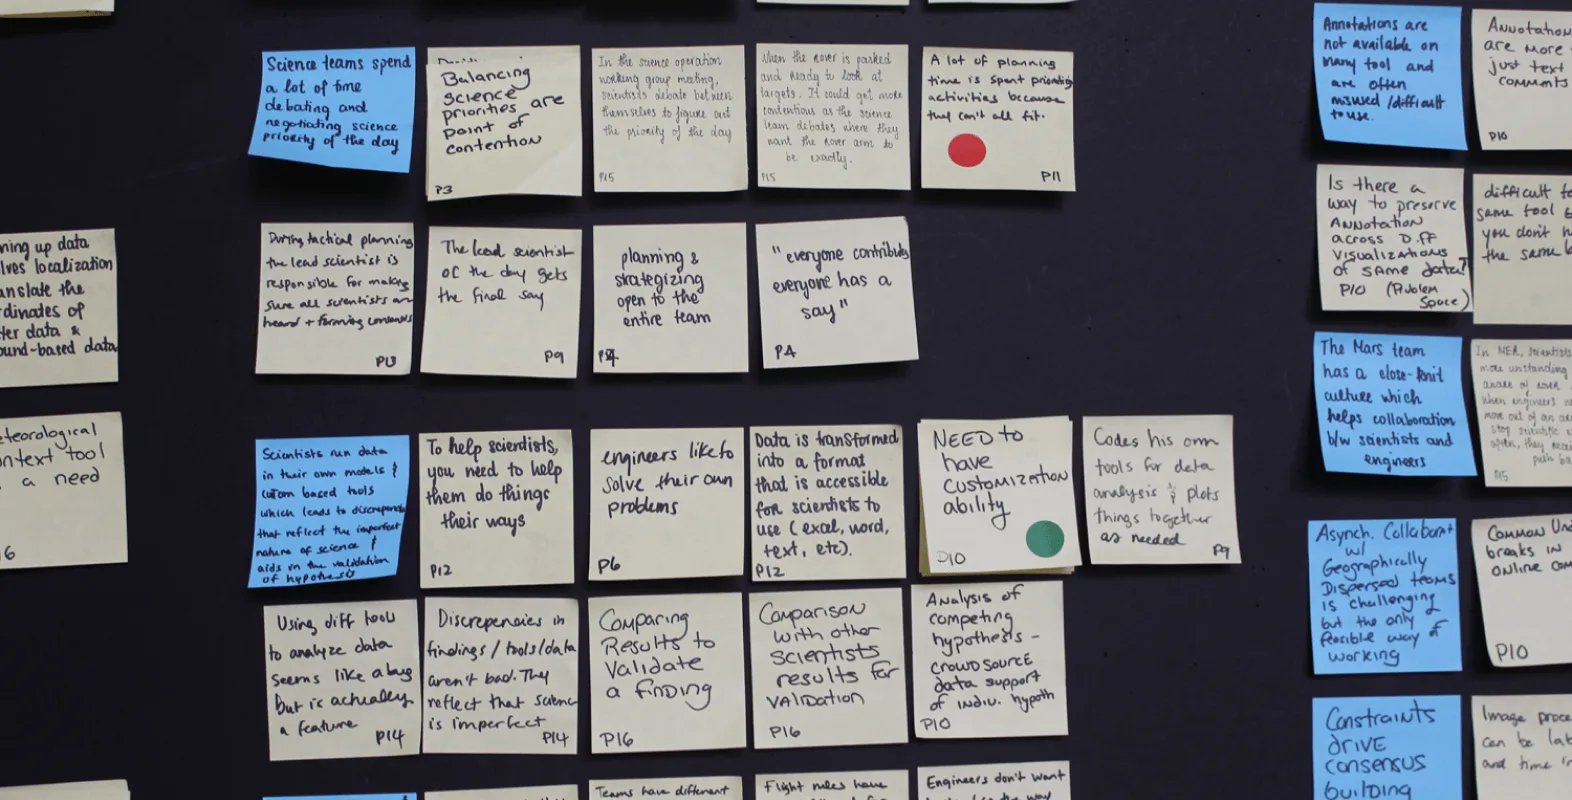
User & Expert Interviews
We conducted interviews with 18 NASA scientists, engineers, and experts to further explore the role of tau during the rover planning process. The goal was to understand how tau affects the decision-making process and collaboration among mission teams to find proper design opportunities. Semi-structured interviews, directed storytelling, and iterative diagraming were the 3 main methods for our research activity.
Insights
Meeting the proposed 5-hour operational timeline is unattainable unless rover teams shift focus to long-term goals.
In the very beginning, it took about 12 hours to just send one day's worth of uplink to Curiosity. I think it reduced down to an average of like seven to eight. On really great days, [...], they got really close to five.
Weather on Mars is relatively predictable, however, there is no weather forecasting despite its potential applications to long-term planning purposes.
Scientists [predicted]...that Mars was going to get a really big dust storm and it did. That's why Opportunity no longer works, but they were able to predict it fairly well and that's because there's this pattern pretty frequently that occurs on Mars.
Unavailable atmospheric opacity (tau) measurements in internal tools negatively impact operational efficiency.
Before [scientists] go off and start harassing the folks that do the image processing to get it into the pipeline of what's wrong and why is this broken? It's a lot nicer to go, ‘oh, okay, I'm dealing with the local dust storm, kick the tau up for a day or two.’
Data is more revealing when contextualized with other observations. Existing tools do not have this capability, hindering scientific discovery.
For meteorology, time of day is crucial. So if there were a way to compare and contrast a couple of different days, that would be really helpful. Instead of looking at the left half of this plot and the right half. You'd have to visually try to compare this feature to that feature, and that would be awkward.
Problem Statement
How can we help scientists understand and predict the impact of atmospheric opacity (tau) on instrumentation and data?
Design principles
Facilitate debate
The advancement of scientific knowledge stands to benefit from disagreement as dissent breeds productive debate to reconcile conflicts. Our tool needs to facilitate healthy discussion between differing points of view to drive scientific advancement.
Prioritize customization and flexibility
Scientific discoveries stem from finding novel ways to analyze and interpret data. To promote further exploration, the tool needs to provide scientists the ability to explore a dataset in various ways without disrupting existing work preferences.
See through the same lens
Scientists are using their own tools and this could lead to misunderstandings about the meaning of their output. As a result, enabling shared mental models is crucial to ground conversations.
Show how things fit in a bigger picture
Scientists and engineers should understand how their work impacts each other and the overall mission. This can be done through contextualizing data to provide a comprehensive view of the situation.
Stay transparent
Understanding the history of data is just as important as understanding what it means. To scientists, knowing the provenance of data facilitates trust, exposes caveats, and helps ground the conversations.
Explore existing products and features
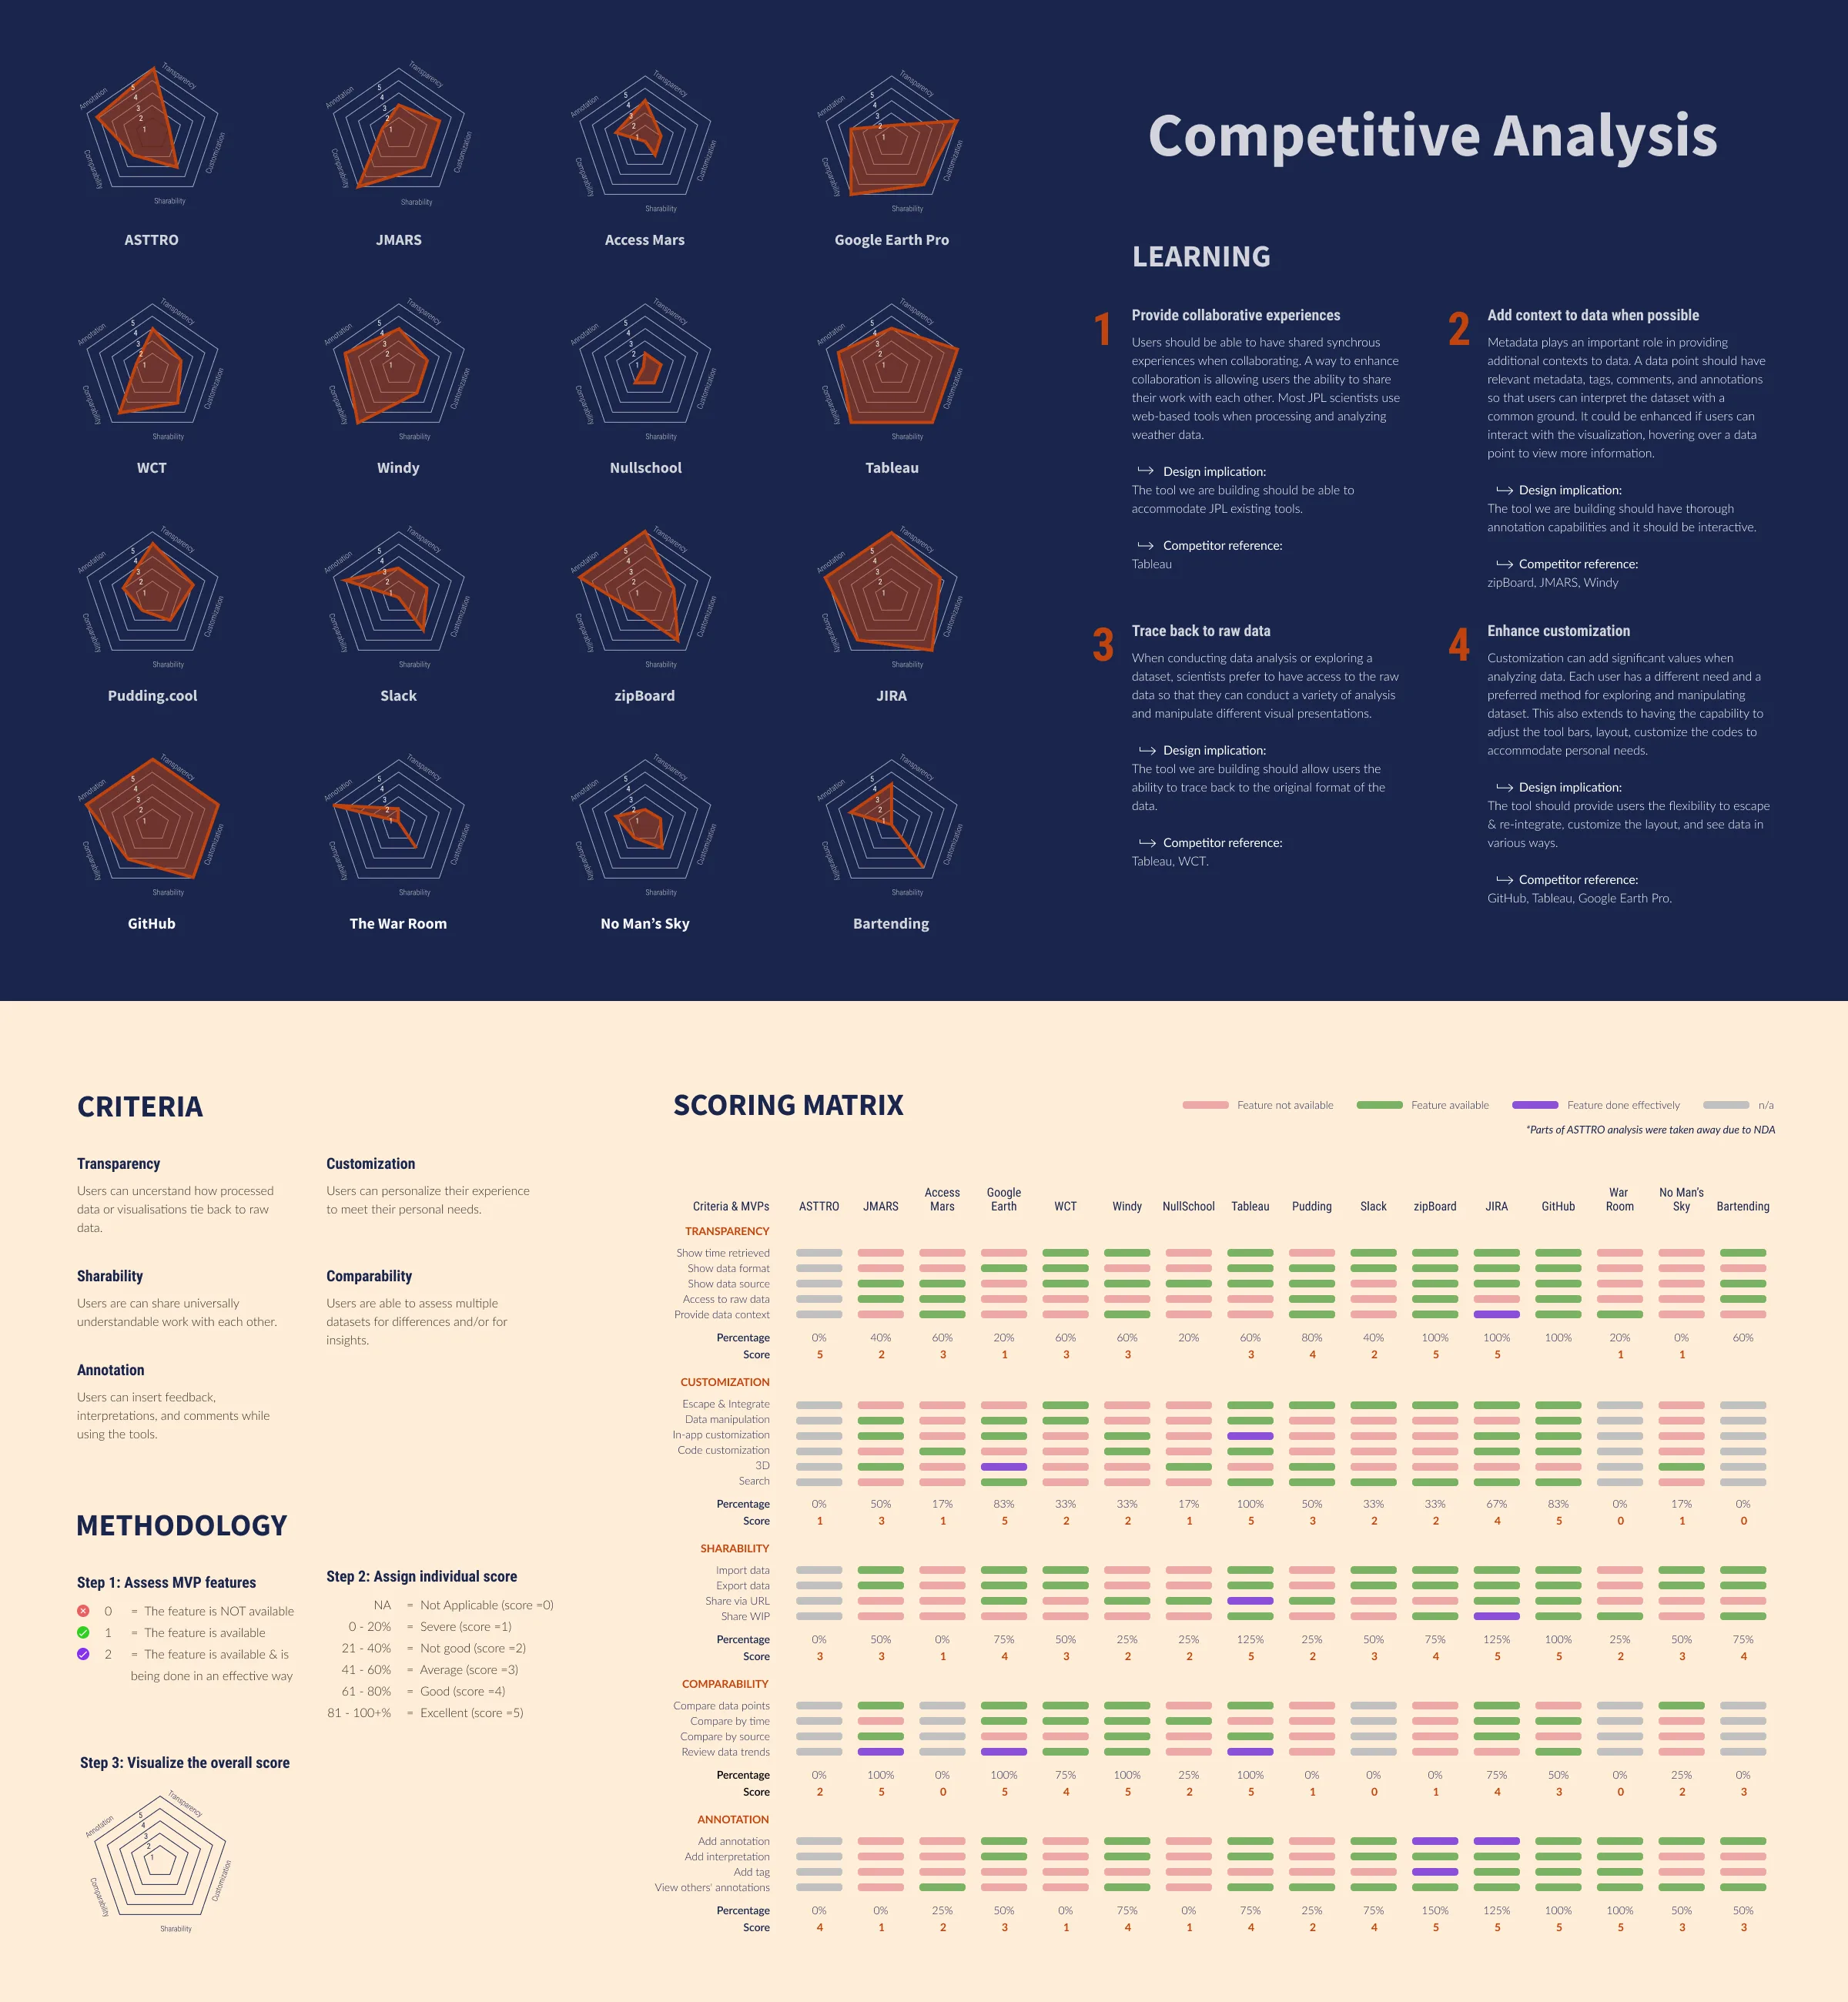
COMPETITIVE ANALYSIS
We approached the competitive analysis with the intention to assess a variety of tools related to collaboration, communication, mapping, and data visualization. The analysis included translational products to better understand how other industries approach solving issues related to collaboration in time-pressing situations.
Ideate and determine interactions
IDEATION
![]() We used the design requirements to evaluate and narrow down 120 features and concepts.
We used the design requirements to evaluate and narrow down 120 features and concepts.
When deciding on rover targets or generating a daily rover plan, mission teams use web-based platforms. Together with other information gathered from research, we found a narrow scope stepping into the ideation process. A lot of our effort at this phase was to focus on identifying what kind of features to be included in the tool. To make sure we didn’t miss out on potential product ideas, we also allocated some proper time to think about other product mediums that were not web-based.
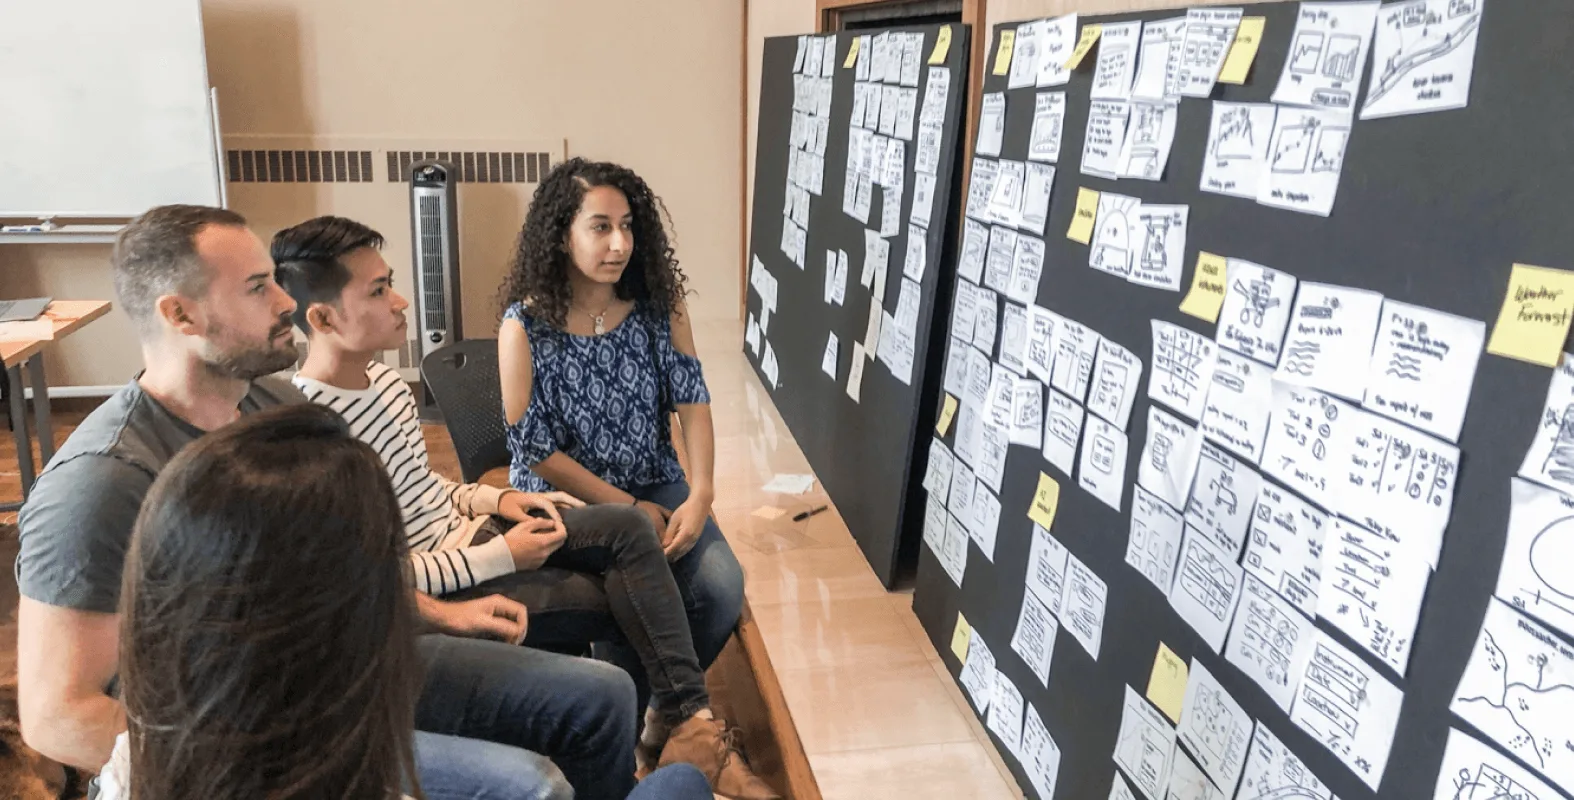
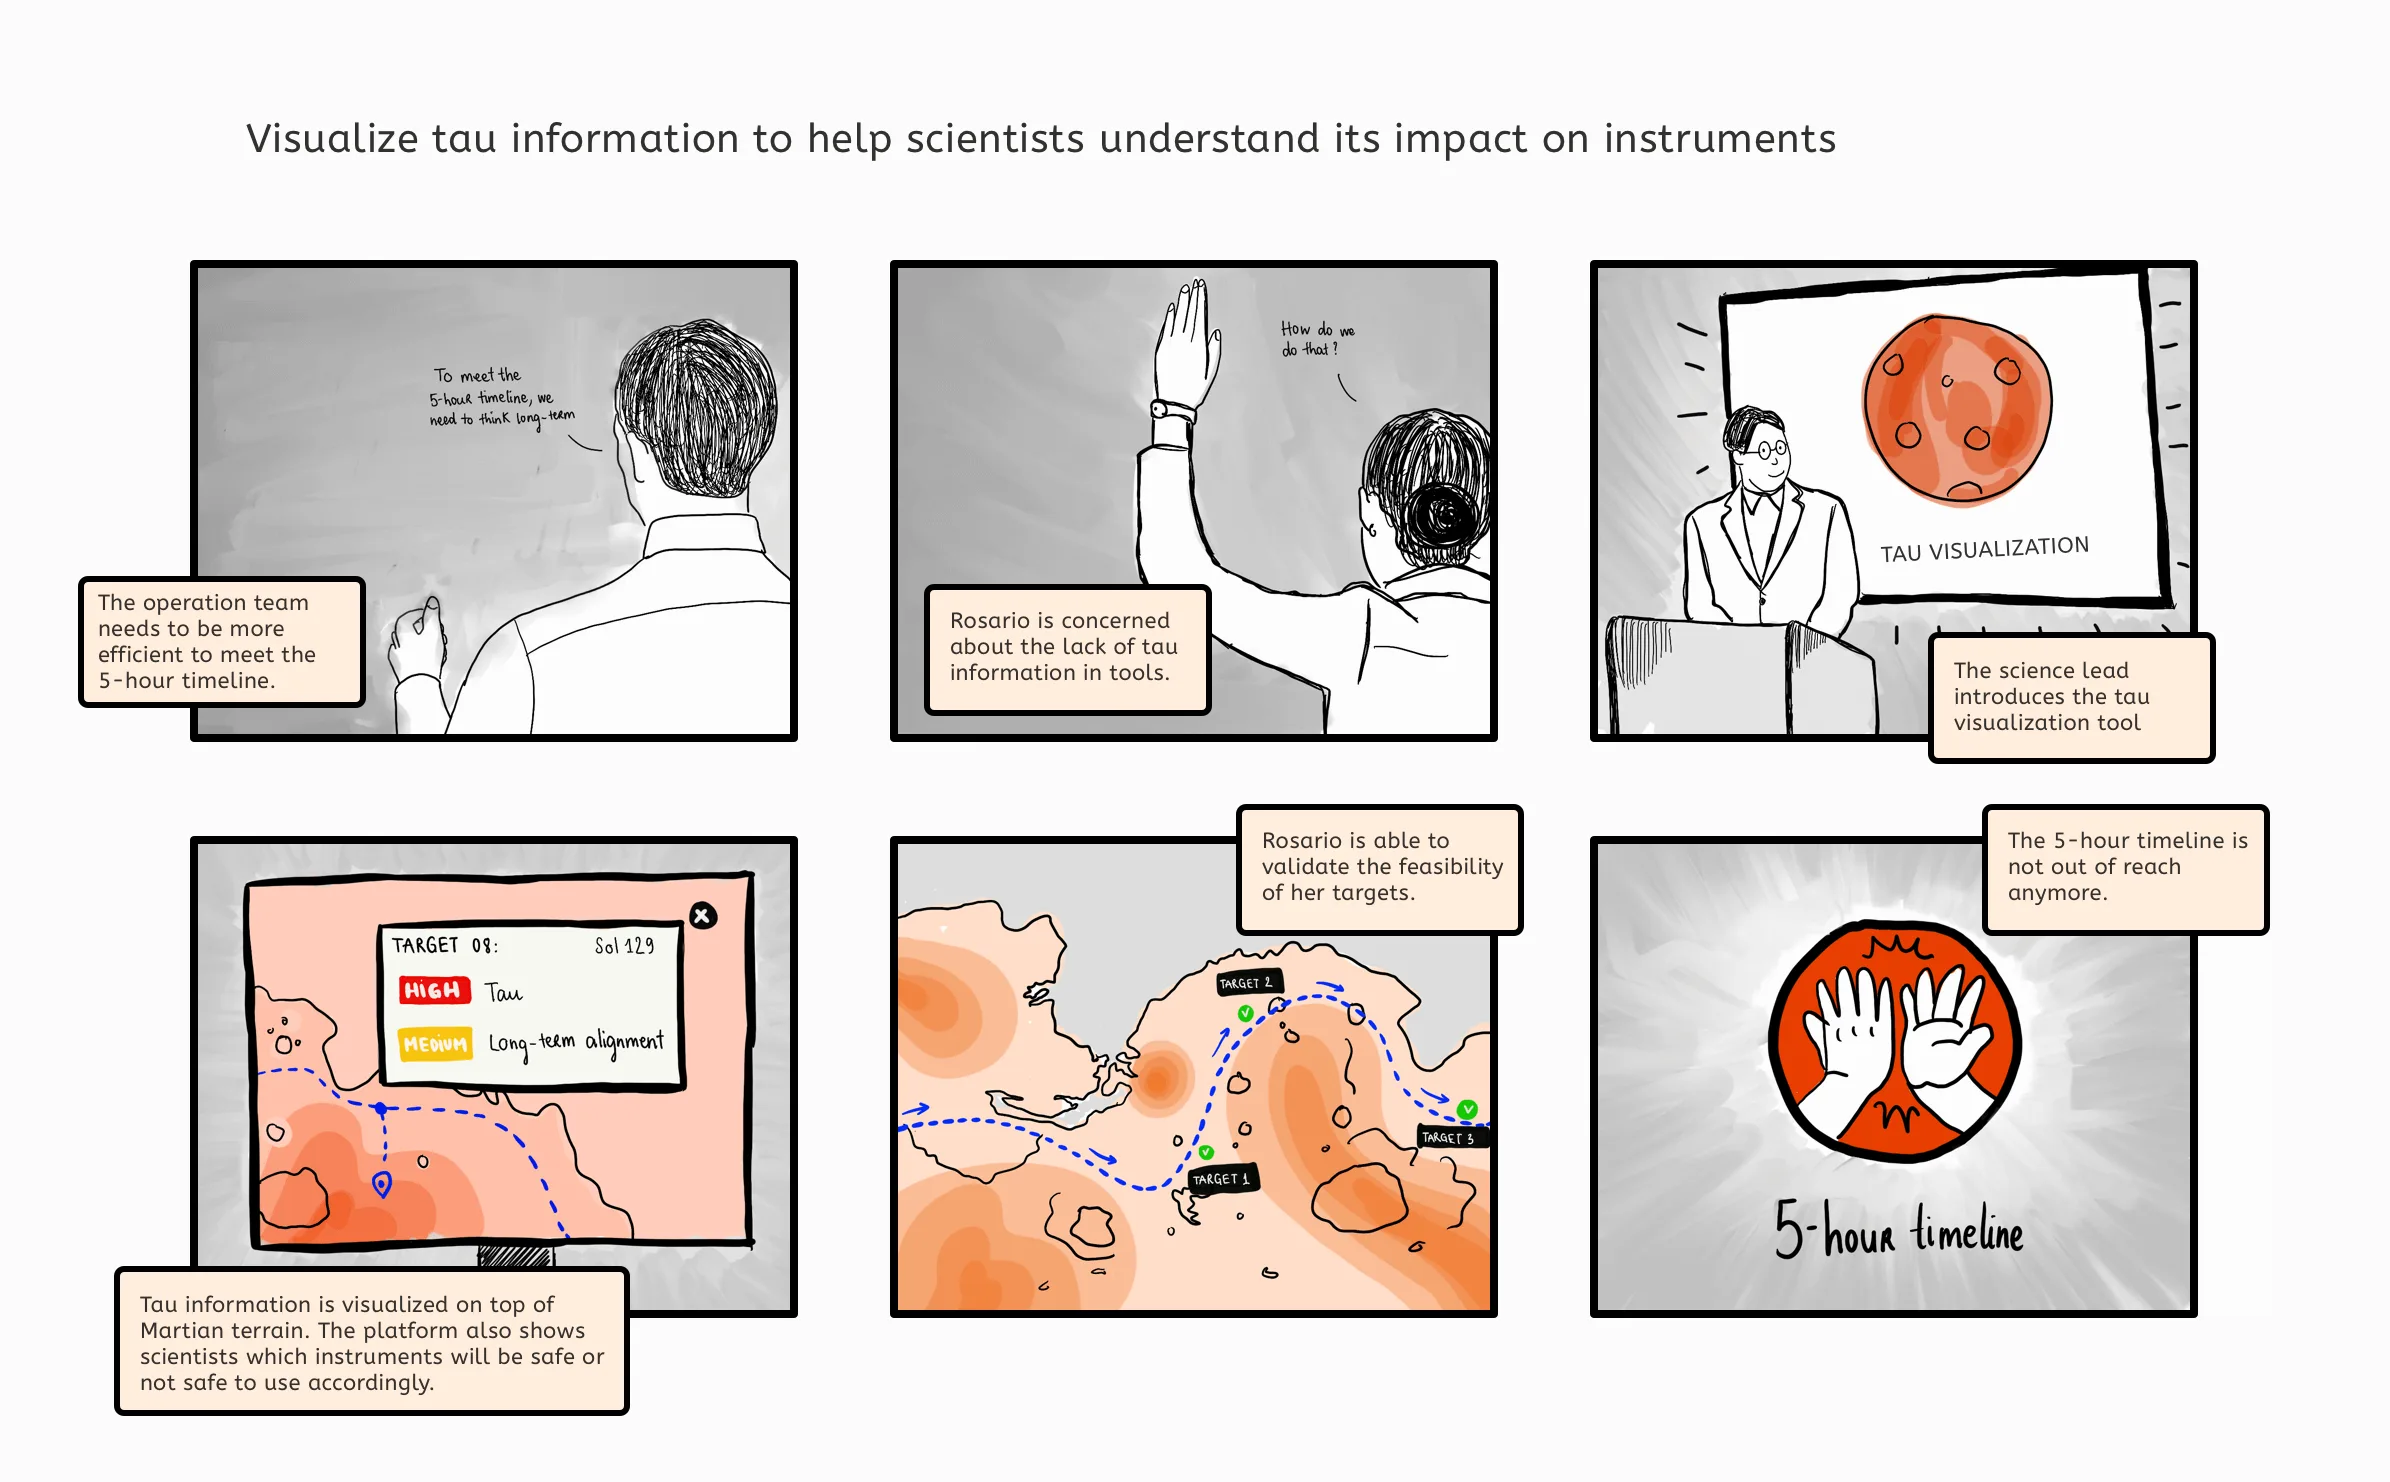
Storyboard
We then storyboarded 6 concepts to explore the experiences and assess whether they would help solve the pain points. Storyboards helped us apply proper contexts to each idea, learning where the concept may fall short and what kind of interactions were needed to make the experience happen.
Design iteration
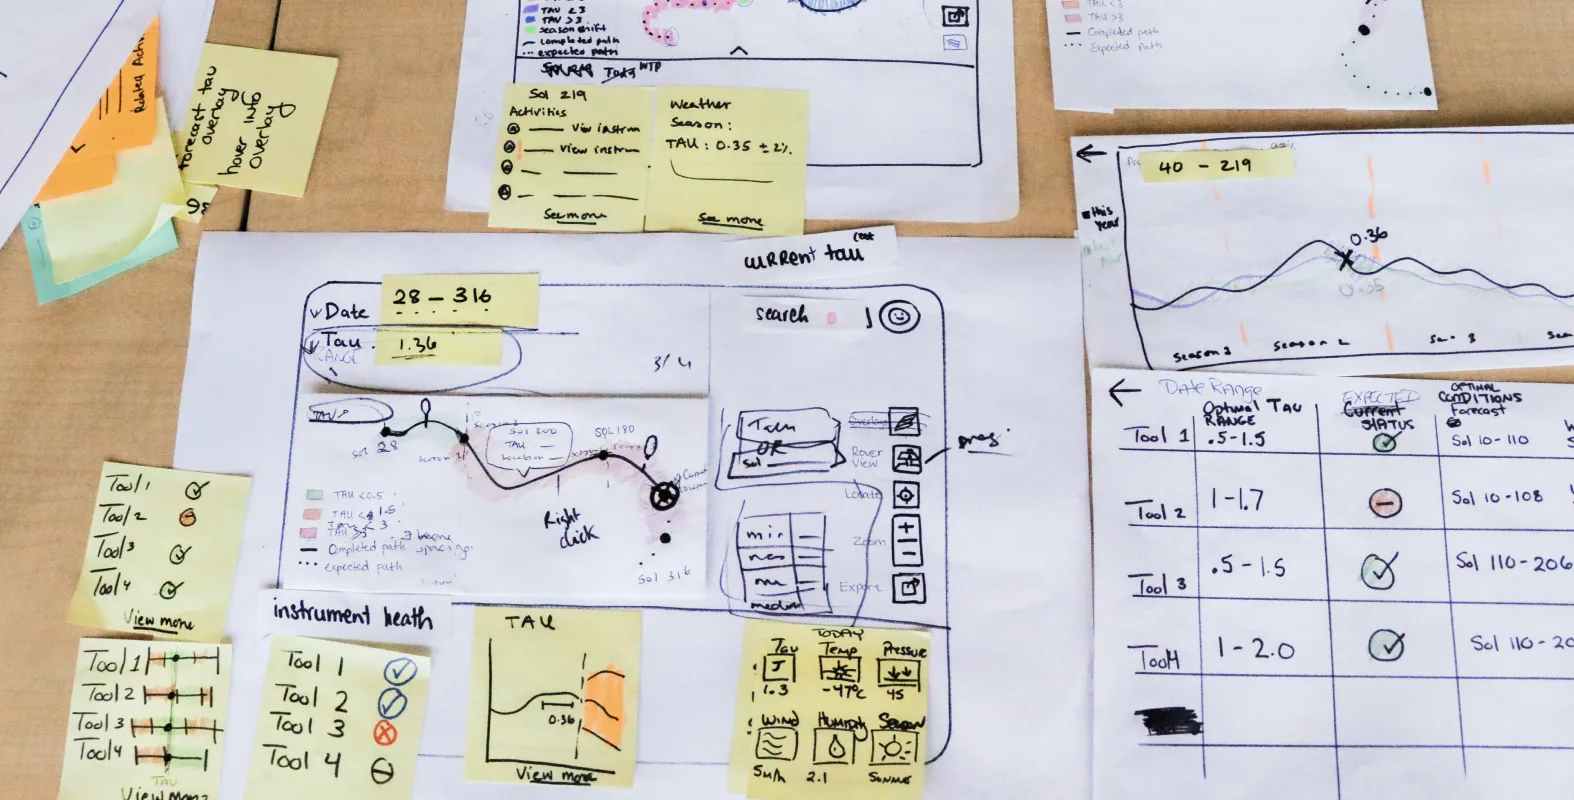
PAPER PROTOTYPE
Paper prototype was used early on to explore interaction concepts. We then quickly moved to digital prototype so that we could test with scientists remotely. Before testing with scientists, we ran several usability sessions with peers in our cohort to quickly spot obvious usability issues.
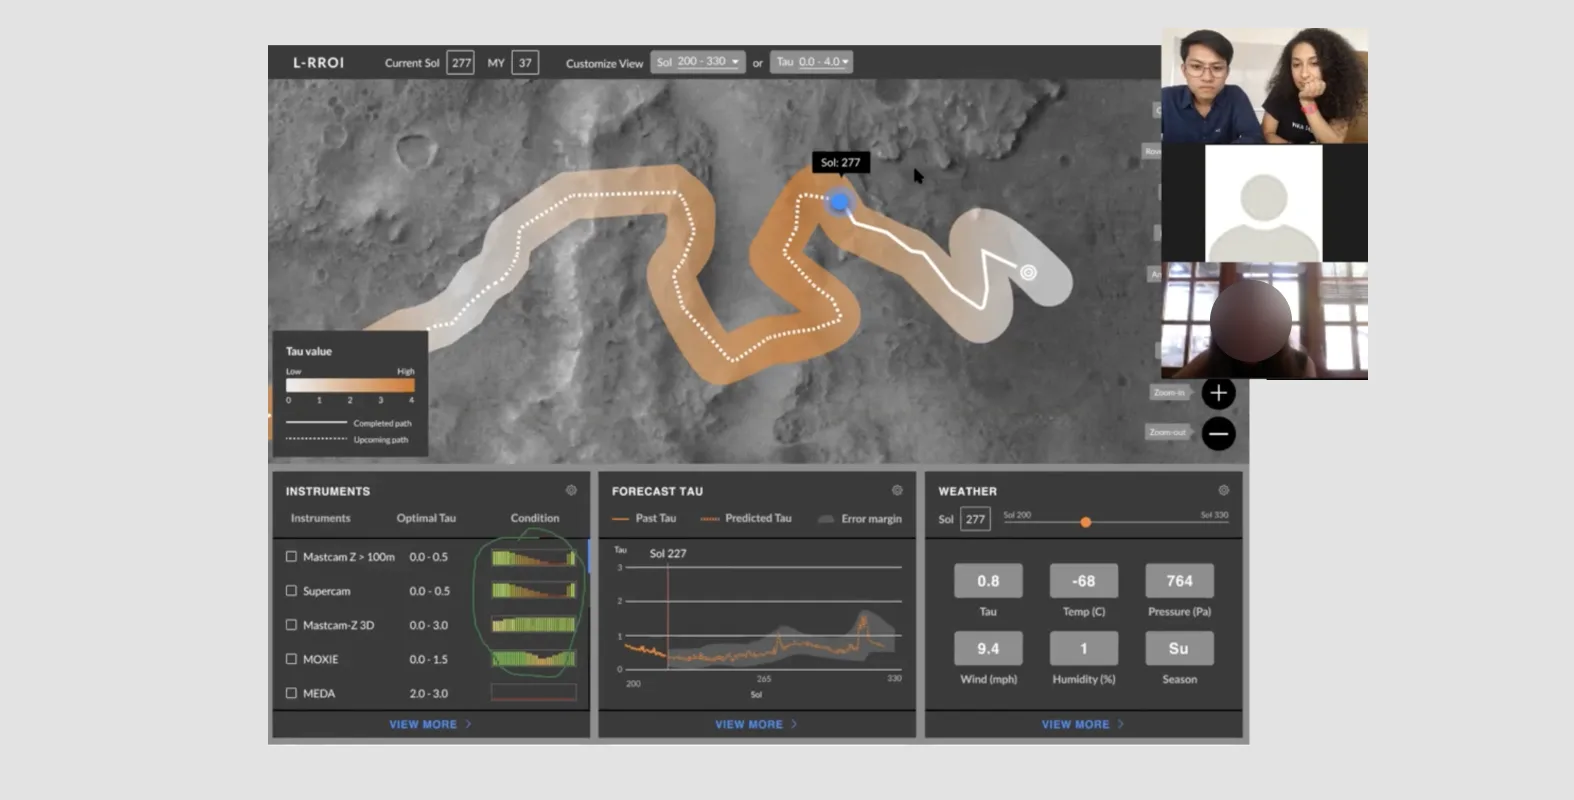
![]() Remote usability testing with participants via Zoom.
Remote usability testing with participants via Zoom.
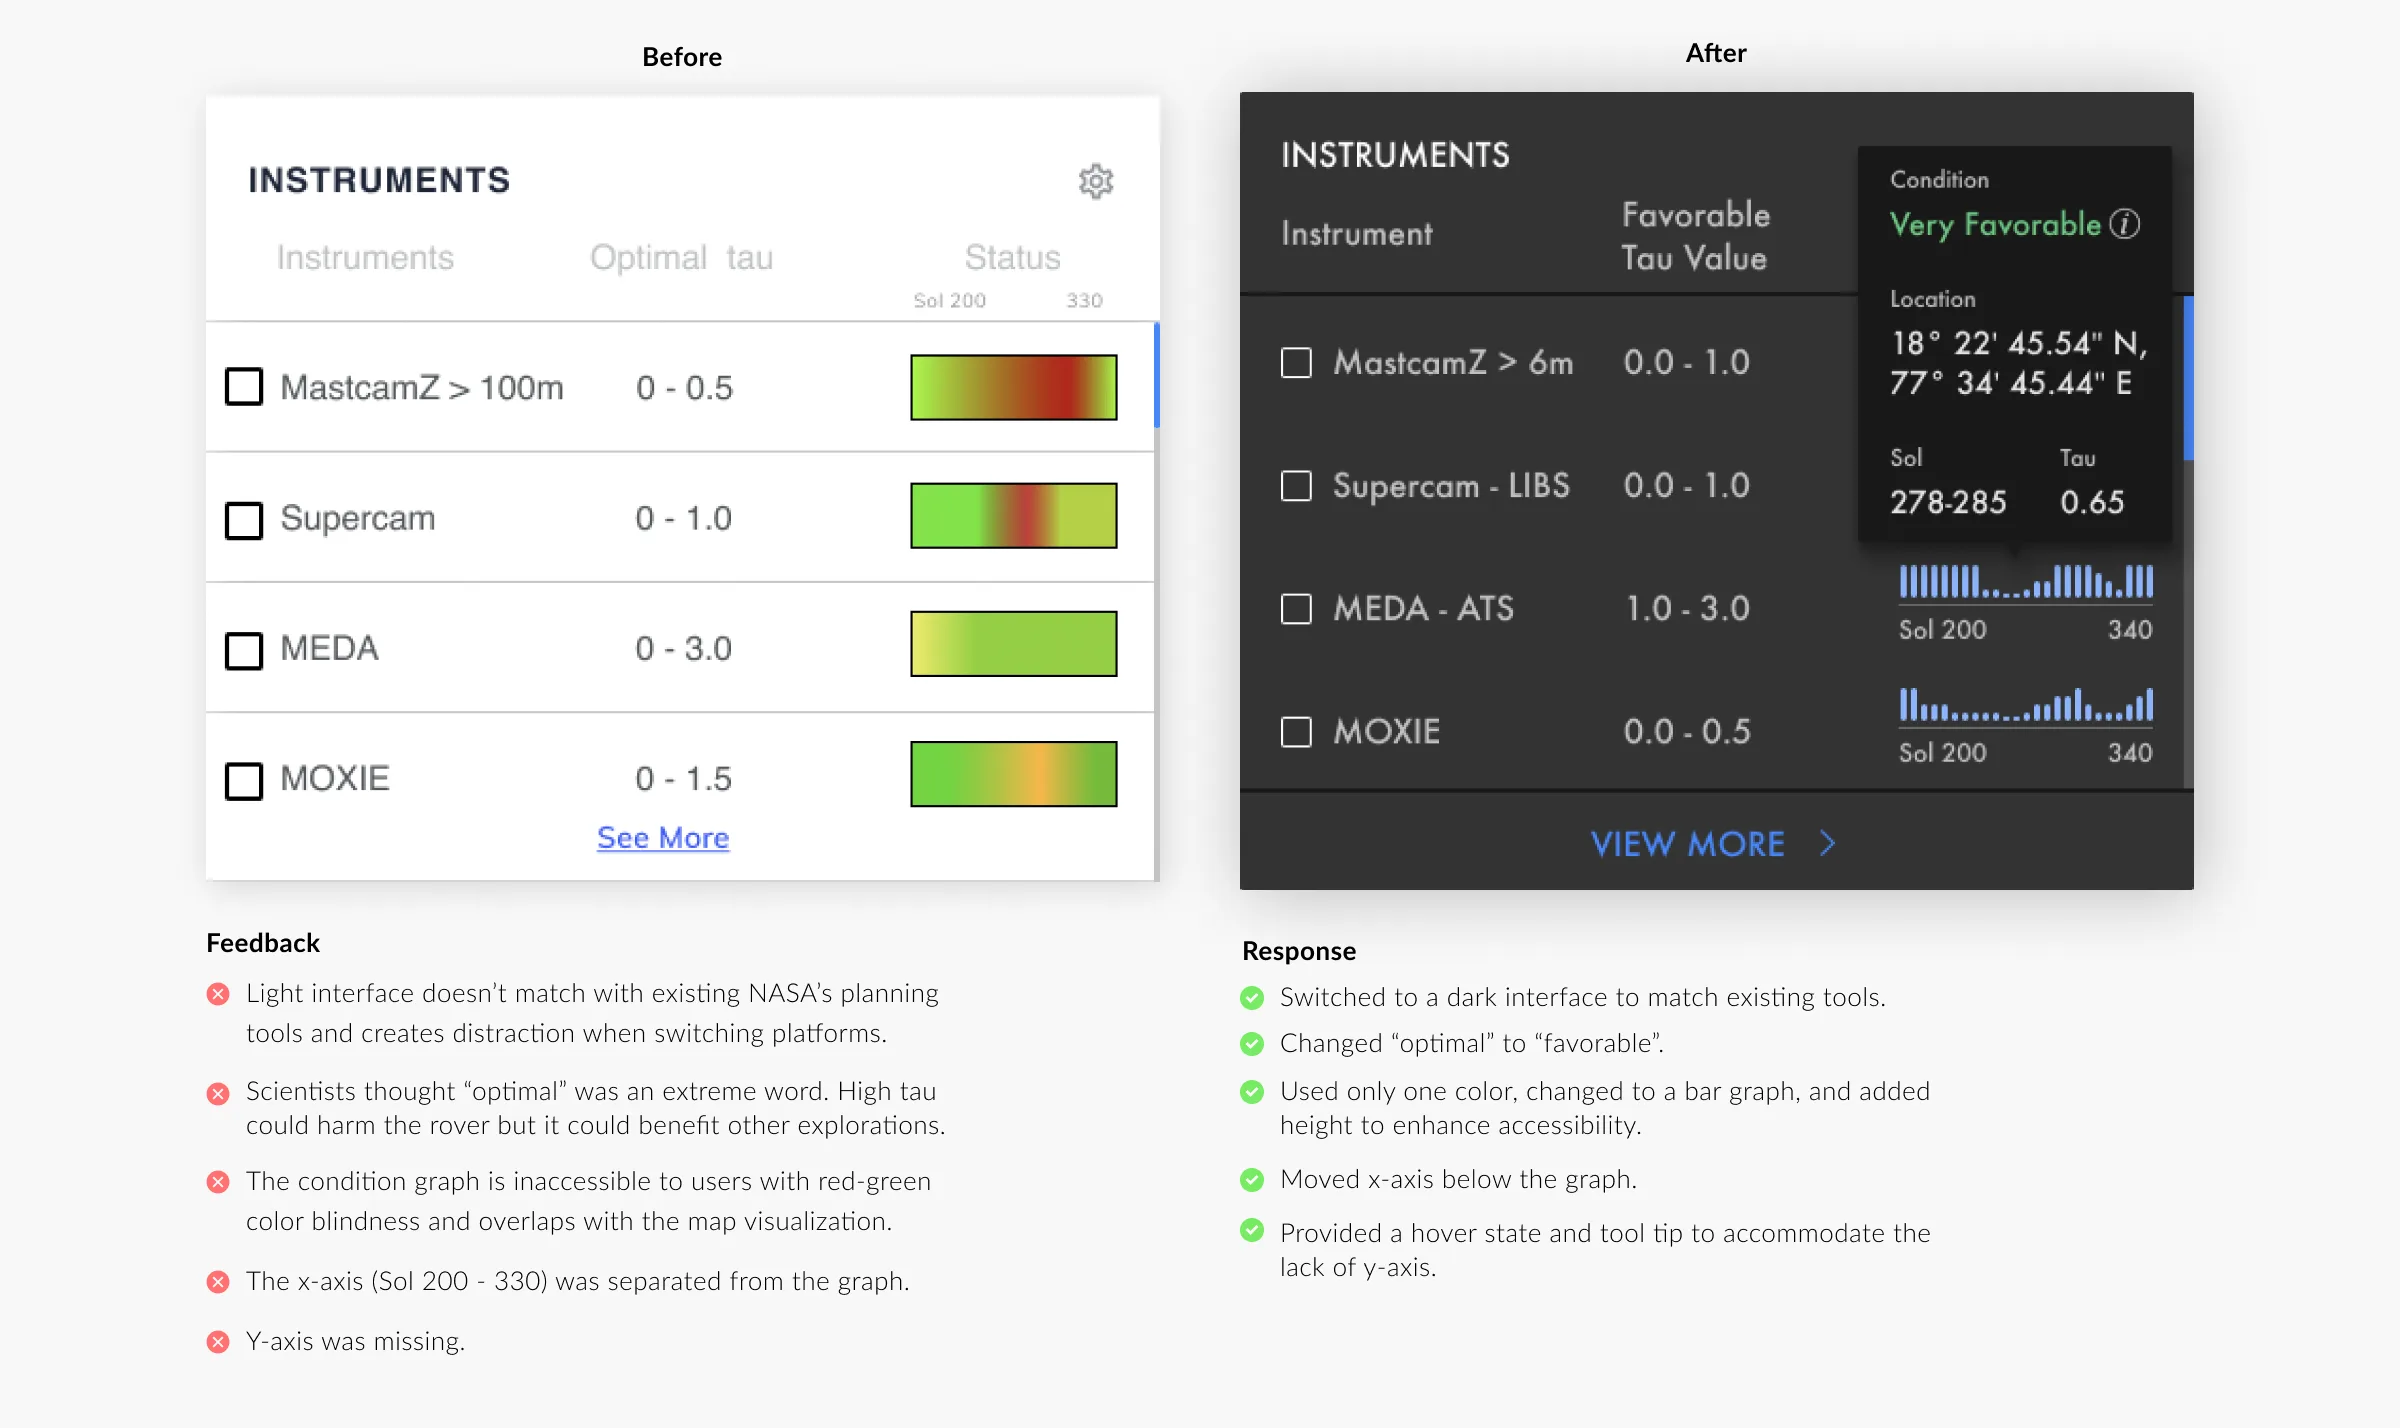
ITERATION 1: INSTRUMENT PANEL
The goal of the instrument panel is to allow scientists to quickly identify when is the best time to use an instrument. Green means it’s safe to use and red means it’s harmful.
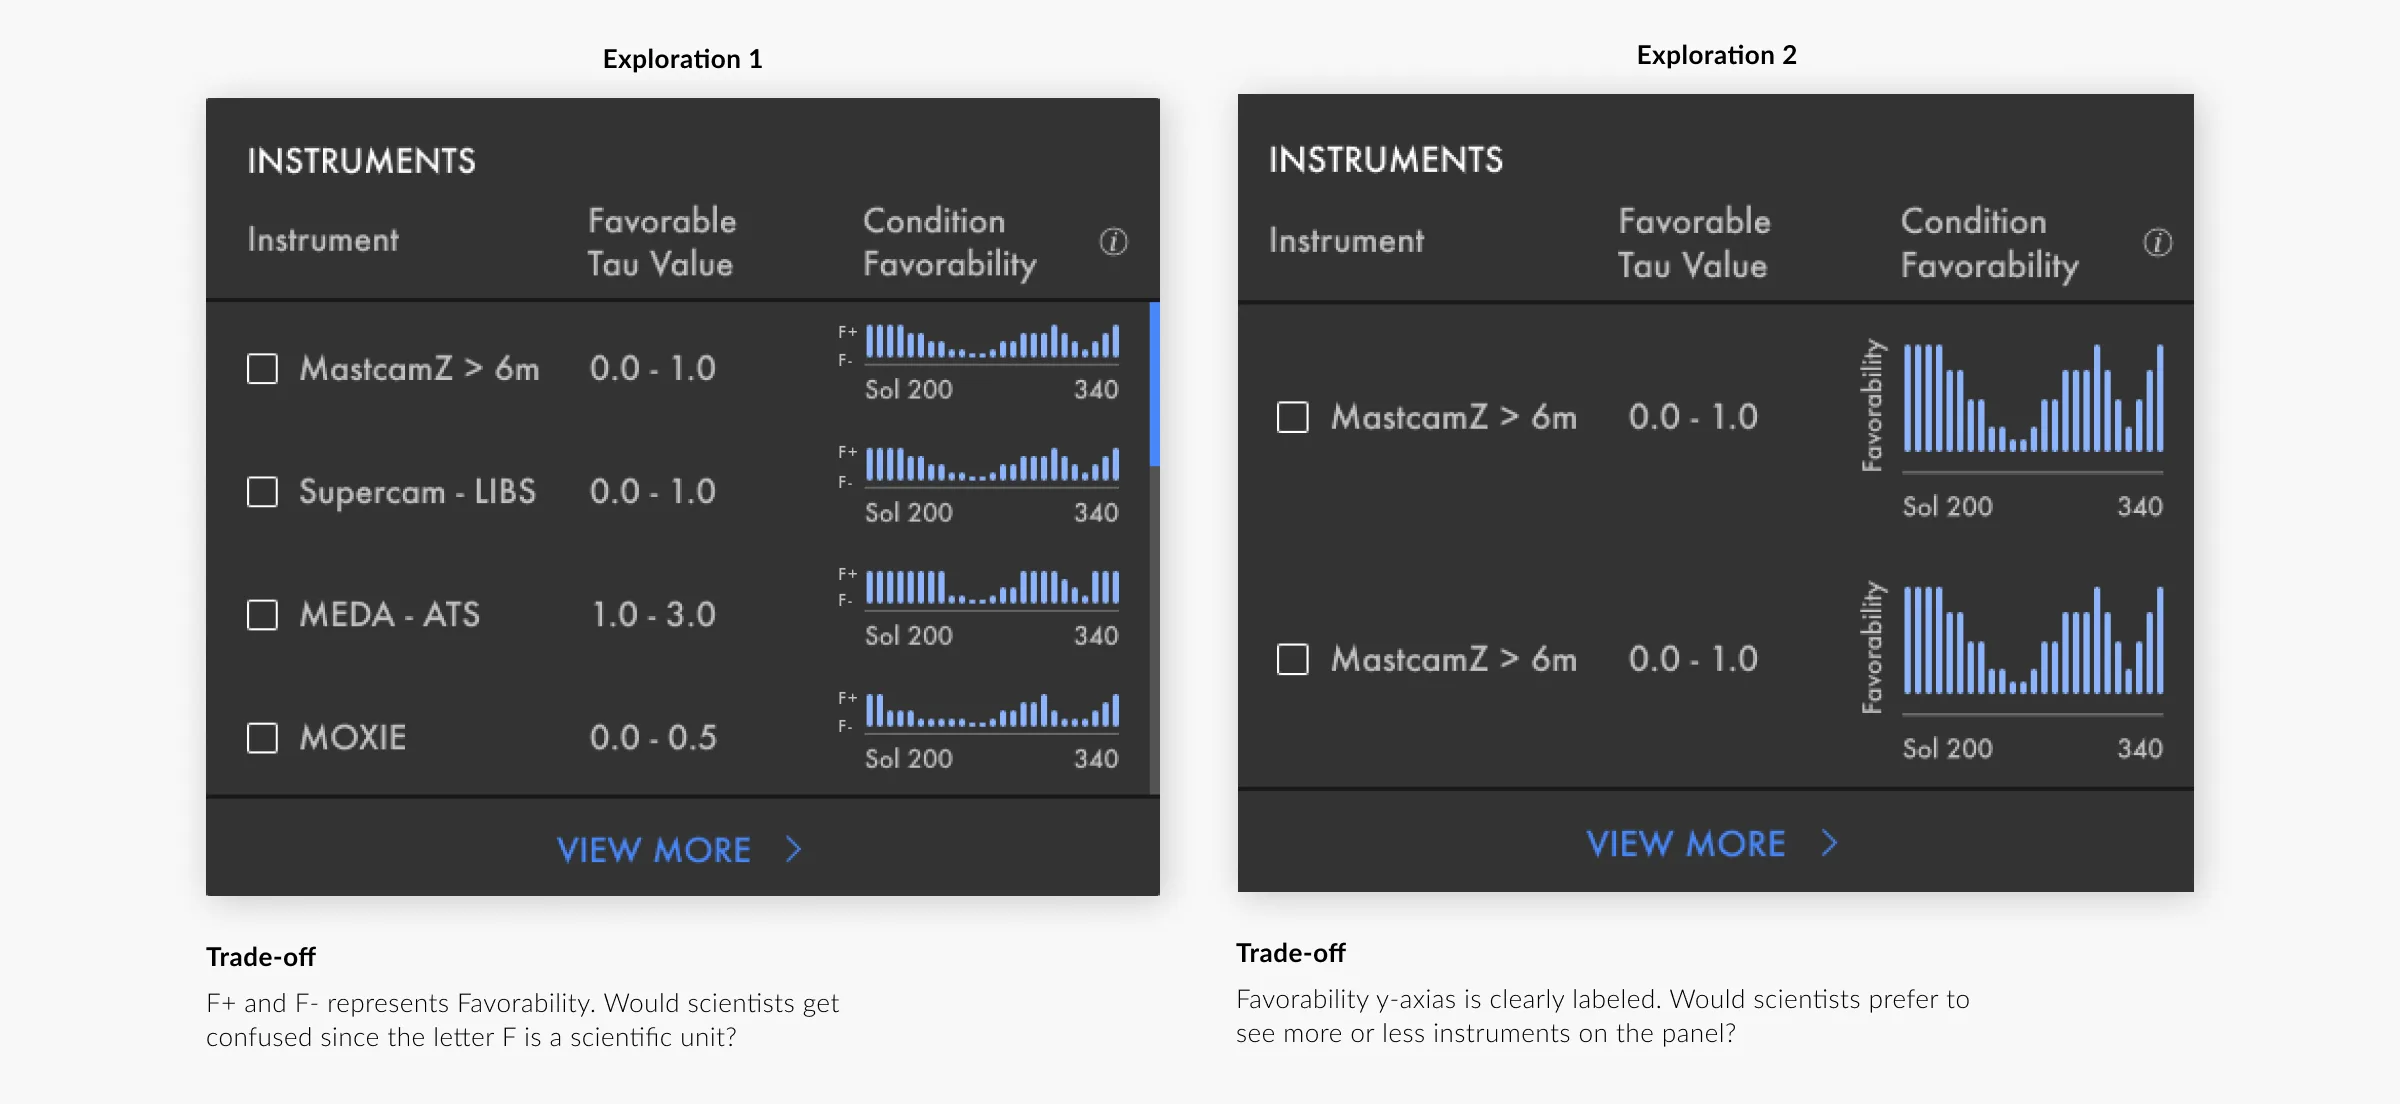
Even though the final design achieved better usability, we decided to explore 2 more options that included the y-axis. Each design below has its trade-off and should be tested against the final design for further evaluation.
ITERATION 2: ROVER VIEW PANEL
The goal of the rover view panel is to allow scientists to simulate what images would look like given the predicted tau value. Scientists can avoid taking images that would not be usable and save rover battery for other activities.
ITERATION 3: SEASONAL TAU PANEL
The goal of the seasonal tau feature is to give scientists access to historical tau data so they can quickly assess data trends and patterns over time.
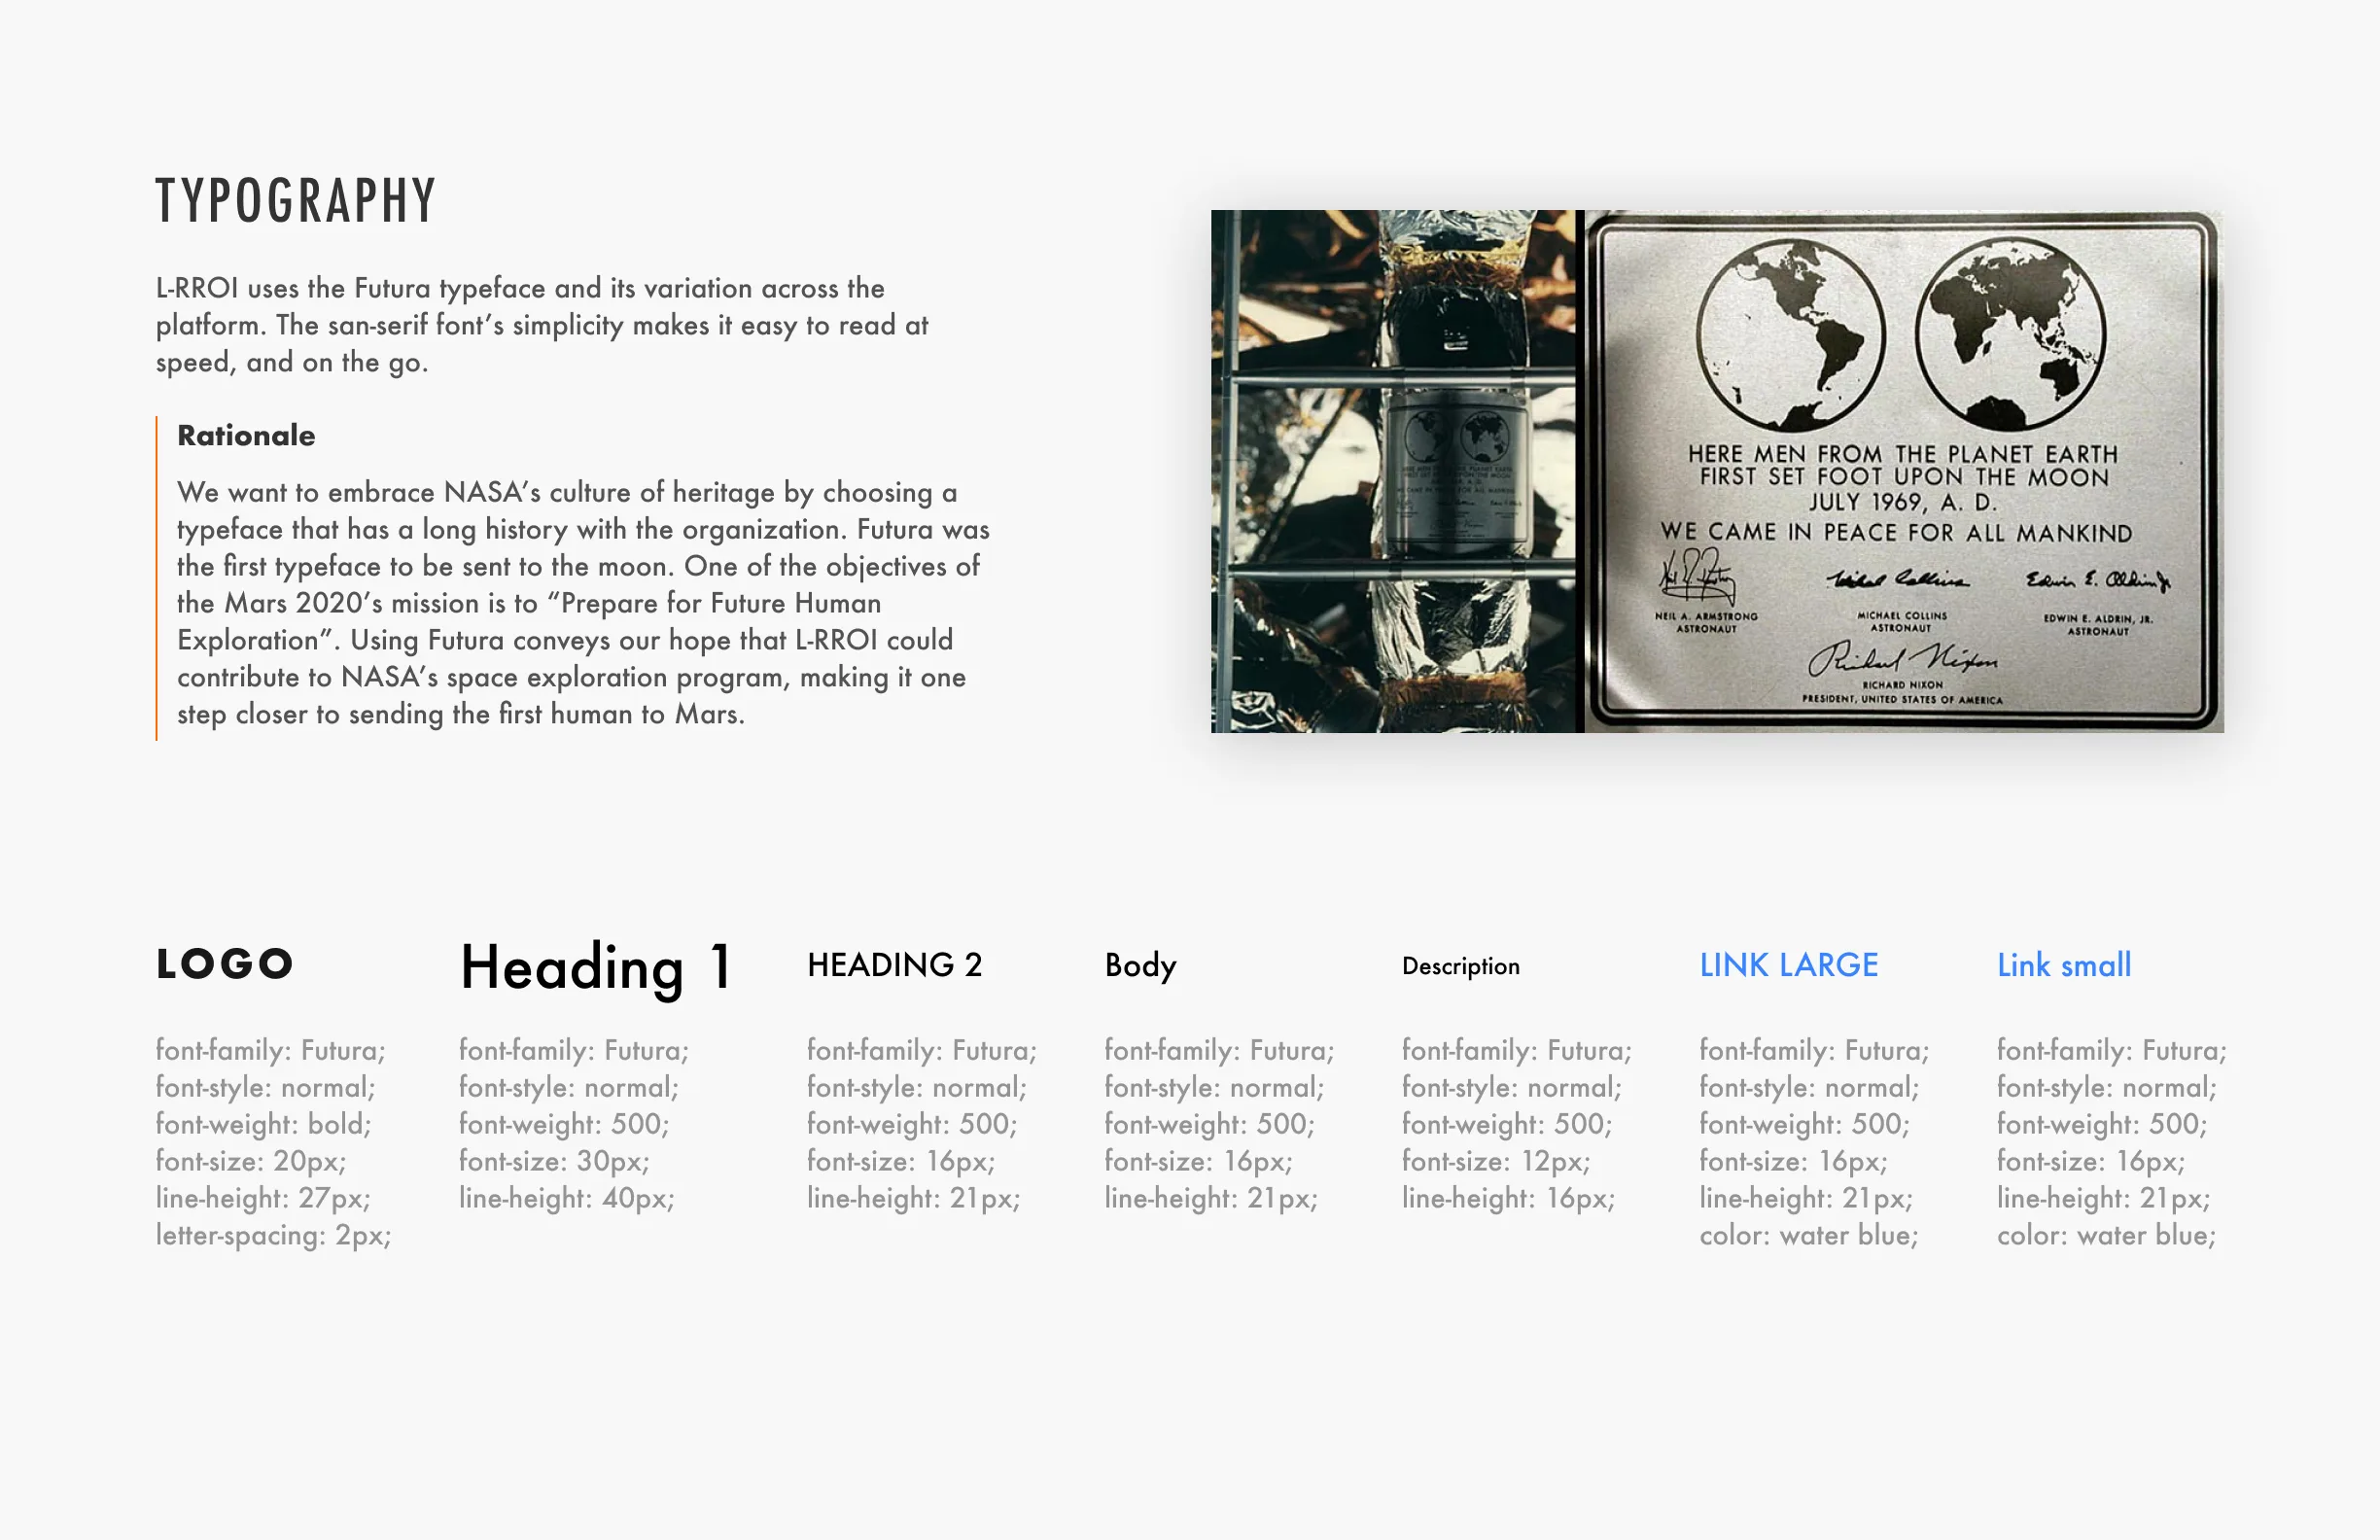
Integrate visual systems
UI SPECIFICATION
Once the structure of L-RROI was figured out, I took the lead in creating a visual system for L-RROI. I documented my process and design rationale for each element in the UI specs.
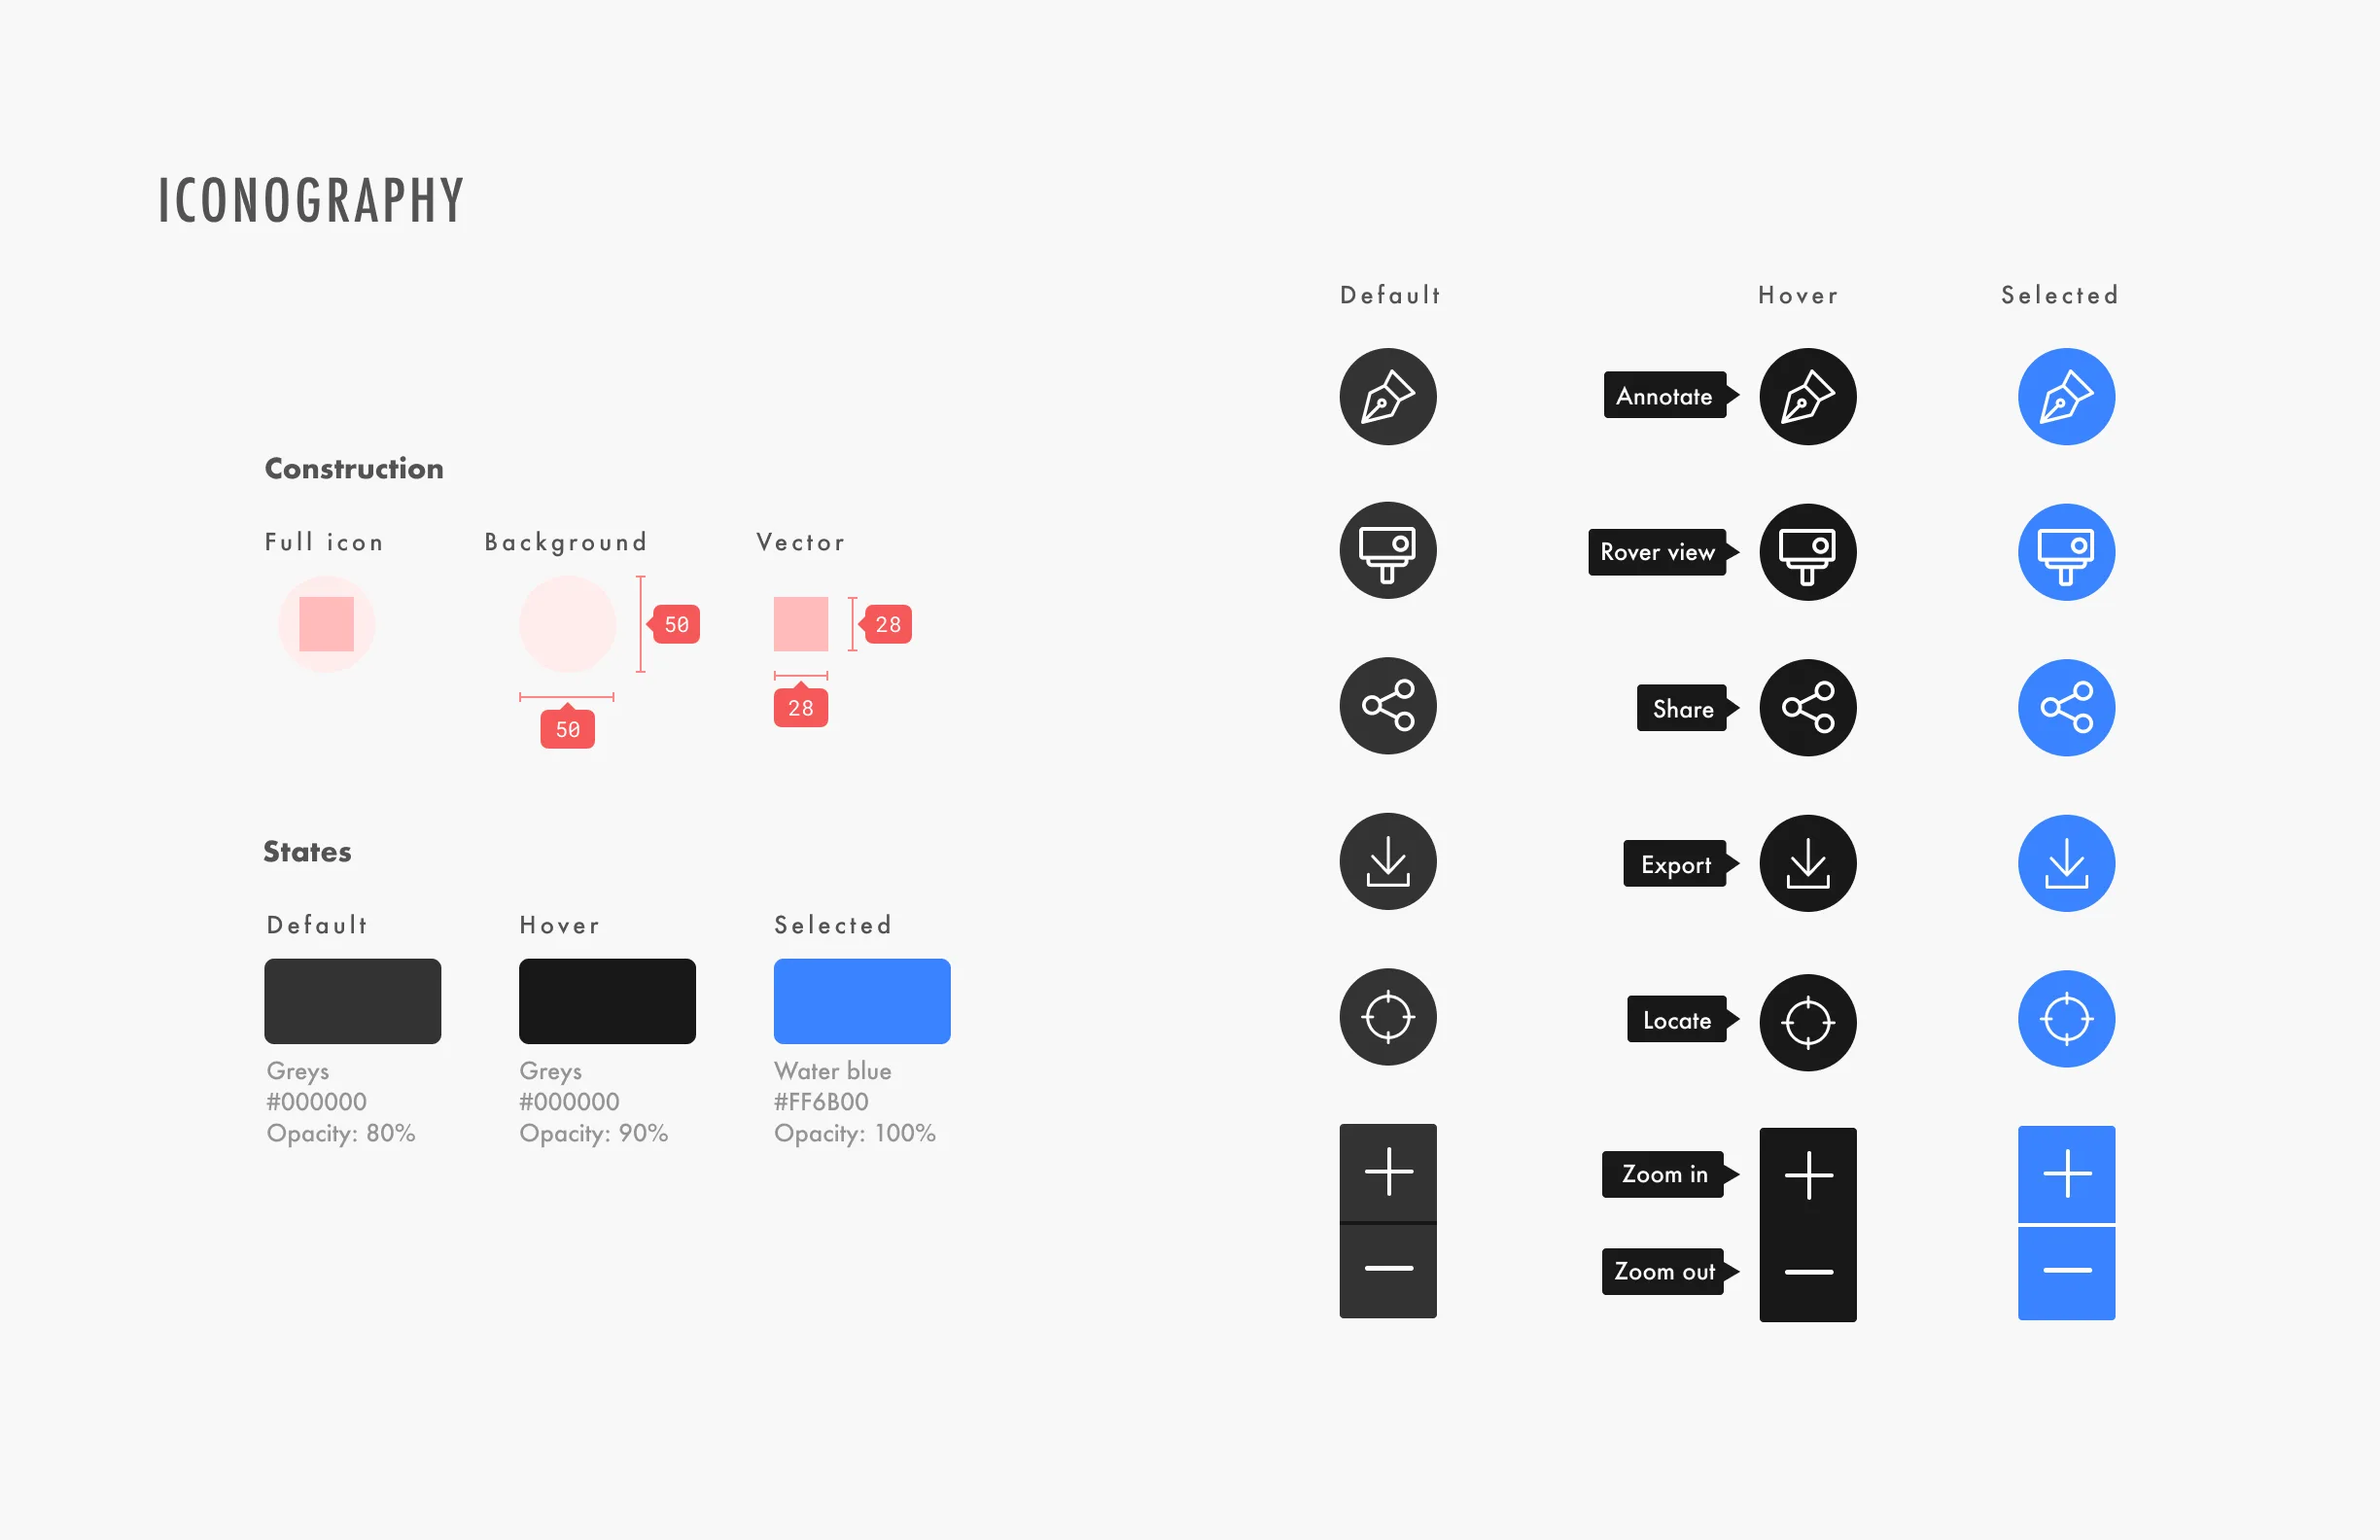
COMPONENT LIBRARY
![]() I created a component library in Figma to ensure visual consistency.
I created a component library in Figma to ensure visual consistency.
SCALABILITY
![]() The component library allowed us to quickly scale the design. We were able to deliver 2 responsive wireframes as a part of the design handoff.
The component library allowed us to quickly scale the design. We were able to deliver 2 responsive wireframes as a part of the design handoff.
Outcome
Yomna, Angela, John, and I defended the project to our advisor at NASA JPL and hosted a poster session to showcase L-RROI to industry professionals. We received both great enthusiasm and positive feedback.
How soon can we build this?
- NASA Instrument Scientist
I think this is really great. NASA has a legacy tool problem and most of the internal tools here don't have good usability or modern UI. I can see how this tool can help scientists on the Mars 2020 mission and I really enjoy the visual design of the tool.
- NASA Student Researcher, M2020 team
Reflection
What I learned
Incremental progress is critical
In such a high-stakes and high-risk environment like NASA, design can make an impact by focusing on making progress incrementally. Design sometimes isn't to find the next big thing to solve, helping scientists improve the internal process can help designers gain trust and expand the influence of design within the organization.
Know your audience and speak in their language
One thing that our team did effectively stepping into the project was preparing ourselves with technical knowledge and learning the lingo at NASA. This helped us build rapport with scientists quickly during the research phase, leading to more productive conversations.
What I’d do differently
Move to digital wireframes quicker when testing remotely
Paper prototype can yield effective results when testing with participants in-person. Since we worked with NASA JPL remotely on this project, it was hard to test without making the tool clickable or interactive.
Narrow down the scope earlier, especially with technical projects
After the research phase, our project scope wasn't entire well-defined. We didn't foresee that such a technical project would require a much smaller scope. This caused the team to conduct a second round of research in parallel with the ideation process in order to identify best uses cases for the tool.
Next steps
Integrate with existing tools
To further avoid the distraction created by switching platforms, we believe that the features of L-RROI can be integrated into existing planning tools.
Scale to include other weather variables and Mars missions
L-RROI was specifically designed to help scientists understand tau on the Mars 2020 mission. It can be scaled to include other weather variables such as temperature, humidity, wind, etc so that scientists can get a comprehensive weather forecasting tool.